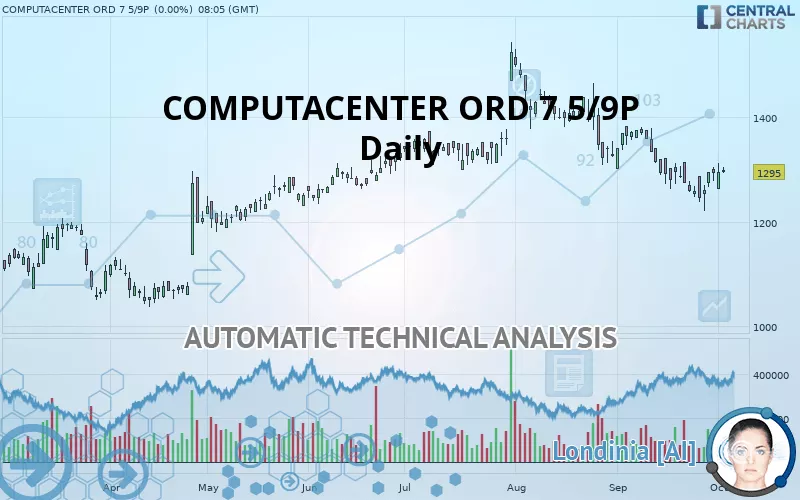
COMPUTACENTER ORD 7 5/9P - Daily - Technical analysis published on 10/02/2019 (GMT)
- 235
- 0
- Who voted?
Click here for a new analysis!
- Timeframe : Daily
- - Analysis generated on
- Status : TARGET REACHED
Summary of the analysis

Additional analysis
Quotes
The COMPUTACENTER ORD 7 5/9P price is 1,295 GBX. The price registered an increase of +0.00% on the session with the lowest point at 1,293 GBX and the highest point at 1,305 GBX. The deviation from the price is +0.15% for the low point and -0.77% for the high point.Here is a more detailed summary of the historical variations registered by COMPUTACENTER ORD 7 5/9P:
Technical
A technical analysis in Daily of this COMPUTACENTER ORD 7 5/9P chart shows a slightly bearish trend. 57.14% of the signals given by moving averages are bearish. This slightly bearish trend could be reinforced by the strong bearish signals given by short-term moving averages. The Central Indicators scanner does not detect any result on moving averages that would impact this trend.
An assessment of technical indicators shows a moderate bullish signal.
Caution: the Central Indicators scanner currently detects an excess:
Williams %R indicator is overbought : over -20
Type : Neutral
Timeframe : Daily
MACD crosses UP its Moving Average
Type : Bullish
Timeframe : Daily
Parabolic SAR indicator bullish reversal
Type : Bullish
Timeframe : Daily
Price is back over the pivot point
Type : Bullish
Timeframe : Weekly
Williams %R indicator is back under -50
Type : Bearish
Timeframe : Daily
An analysis of the price chart with the Central Patterns scanner (detector of chart patterns and resistances and supports) shows several results that can have an impact on the price change:
Near horizontal resistance
Type : Bearish
Timeframe : Daily
Near resistance of channel
Type : Bearish
Timeframe : Daily
No result was found by the Central Candlesticks scanner on Japanese candlesticks.
| S3 | S2 | S1 | Price | R1 | R2 | R3 | |
|---|---|---|---|---|---|---|---|
| ProTrendLines | 1,124 | 1,193 | 1,274 | 1,295 | 1,321 | 1,374 | 1,438 |
| Change (%) | -13.20% | -7.88% | -1.62% | - | +2.01% | +6.10% | +11.04% |
| Change | -171 | -102 | -21 | - | +26 | +79 | +143 |
| Level | Intermediate | Intermediate | Intermediate | - | Major | Intermediate | Minor |
Attention could also be paid to pivot points to set price objectives:
| Pivot points | S3 | S2 | S1 | PP | R1 | R2 | R3 |
|---|---|---|---|---|---|---|---|
| Standard | 1,219 | 1,241 | 1,268 | 1,290 | 1,317 | 1,339 | 1,366 |
| Camarilla | 1,282 | 1,286 | 1,291 | 1,295 | 1,300 | 1,304 | 1,309 |
| Woodie | 1,222 | 1,242 | 1,271 | 1,291 | 1,320 | 1,340 | 1,369 |
| Fibonacci | 1,241 | 1,260 | 1,271 | 1,290 | 1,309 | 1,320 | 1,339 |
| Pivot points | S3 | S2 | S1 | PP | R1 | R2 | R3 |
|---|---|---|---|---|---|---|---|
| Standard | 1,169 | 1,194 | 1,245 | 1,270 | 1,321 | 1,346 | 1,397 |
| Camarilla | 1,274 | 1,281 | 1,288 | 1,295 | 1,302 | 1,309 | 1,316 |
| Woodie | 1,181 | 1,201 | 1,257 | 1,277 | 1,333 | 1,353 | 1,409 |
| Fibonacci | 1,194 | 1,223 | 1,241 | 1,270 | 1,299 | 1,317 | 1,346 |
| Pivot points | S3 | S2 | S1 | PP | R1 | R2 | R3 |
|---|---|---|---|---|---|---|---|
| Standard | 1,067 | 1,143 | 1,218 | 1,295 | 1,370 | 1,447 | 1,521 |
| Camarilla | 1,251 | 1,265 | 1,279 | 1,293 | 1,307 | 1,321 | 1,335 |
| Woodie | 1,066 | 1,143 | 1,217 | 1,294 | 1,369 | 1,446 | 1,520 |
| Fibonacci | 1,143 | 1,201 | 1,237 | 1,295 | 1,353 | 1,389 | 1,447 |
Numerical data
The following are the details of the technical indicators and moving averages that were collected to generate this technical analysis:
| RSI (14): | 46.00 | |
| MACD (12,26,9): | -18.0000 | |
| Directional Movement: | -7 | |
| AROON (14): | -71 | |
| DEMA (21): | 1,273 | |
| Parabolic SAR (0,02-0,02-0,2): | 1,225 | |
| Elder Ray (13): | 10 | |
| Super Trend (3,10): | 1,352 | |
| Zig ZAG (10): | 1,294 | |
| VORTEX (21): | 1.0000 | |
| Stochastique (14,3,5): | 61.00 | |
| TEMA (21): | 1,266 | |
| Williams %R (14): | -27.00 | |
| Chande Momentum Oscillator (20): | 3 | |
| Repulse (5,40,3): | 1.0000 | |
| ROCnROLL: | -1 | |
| TRIX (15,9): | 0.0000 | |
| Courbe Coppock: | 7.00 |
| MA7: | 1,277 | |
| MA20: | 1,299 | |
| MA50: | 1,351 | |
| MA100: | 1,315 | |
| MAexp7: | 1,286 | |
| MAexp20: | 1,299 | |
| MAexp50: | 1,318 | |
| MAexp100: | 1,294 | |
| Price / MA7: | +1.41% | |
| Price / MA20: | -0.31% | |
| Price / MA50: | -4.15% | |
| Price / MA100: | -1.52% | |
| Price / MAexp7: | +0.70% | |
| Price / MAexp20: | -0.31% | |
| Price / MAexp50: | -1.75% | |
| Price / MAexp100: | +0.08% |
About author

Online


Add a comment
Comments
0 comments on the analysis COMPUTACENTER ORD 7 5/9P - Daily