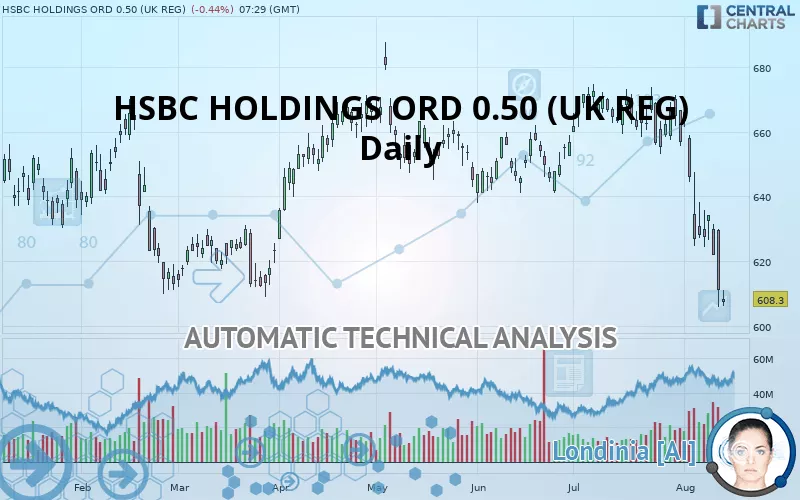
HSBC HOLDINGS ORD USD 0.50 (UK REG) - Daily - Technical analysis published on 08/13/2019 (GMT)
- 447
- 0
- Who voted?
Click here for a new analysis!
- Timeframe : Daily
- - Analysis generated on
- Status : TARGET REACHED

Summary of the analysis

Additional analysis
Quotes
HSBC HOLDINGS ORD 0.50 (UK REG) rating 608.3 GBX. On the day, this instrument lost -0.44% and was between 606.1 GBX and 611.0 GBX. This implies that the price is at +0.36% from its lowest and at -0.44% from its highest.The Central Gaps scanner detects a bullish opening. A small advantage for buyers in the very short term.
Bullish opening
Type : Bullish
Timeframe : Openning
So that you have an overall view of the price change, here is a table showing the variations over several periods:
Near a new LOW record (1st january)
Type : Bearish
Timeframe : Weekly
Near a new LOW record (1 month)
Type : Bearish
Timeframe : Weekly
Technical
Technical analysis of this Daily chart of HSBC HOLDINGS ORD 0.50 (UK REG) indicates that the overall trend is strongly bearish. The signals given by moving averages are 85.71% bearish. This strong bearish trend is confirmed by the strong signals currently being given by short-term moving averages. An assessment of moving averages reveals a bearish signal that could impact this trend:
Bearish trend reversal : Moving Average 100
Type : Bearish
Timeframe : Daily
Technical indicators are bearish. There is still some doubt about the decline in the price.
But beware of excesses. The Central Indicators scanner currently detects this:
RSI indicator is oversold : under 30
Type : Neutral
Timeframe : Daily
CCI indicator is oversold : under -100
Type : Neutral
Timeframe : Daily
Williams %R indicator is oversold : under -80
Type : Neutral
Timeframe : Daily
Pivot points : price is under support 1
Type : Neutral
Timeframe : Weekly
Price is back under the pivot point
Type : Bearish
Timeframe : Daily
Central Patterns, the market scanner focusing on chart patterns, resistances and supports found these results:
Horizontal support is broken
Type : Bearish
Timeframe : Daily
Support of channel is broken
Type : Bearish
Timeframe : Daily
The Central Candlesticks scanner, specialised in Japanese candlesticks, did not identify any signals.
| S3 | S2 | S1 | Price | R1 | R2 | R3 | |
|---|---|---|---|---|---|---|---|
| ProTrendLines | 463.5 | 544.6 | 594.0 | 608.3 | 612.6 | 644.1 | 661.2 |
| Change (%) | -23.80% | -10.47% | -2.35% | - | +0.71% | +5.89% | +8.70% |
| Change | -144.8 | -63.7 | -14.3 | - | +4.3 | +35.8 | +52.9 |
| Level | Major | Minor | Major | - | Intermediate | Minor | Major |
Attention could also be paid to pivot points to set price objectives:
| Pivot points | S3 | S2 | S1 | PP | R1 | R2 | R3 |
|---|---|---|---|---|---|---|---|
| Standard | 577.0 | 591.4 | 601.2 | 615.6 | 625.4 | 639.8 | 649.6 |
| Camarilla | 604.4 | 606.6 | 608.8 | 611.0 | 613.2 | 615.4 | 617.7 |
| Woodie | 574.7 | 590.3 | 598.9 | 614.5 | 623.1 | 638.7 | 647.3 |
| Fibonacci | 591.4 | 600.6 | 606.4 | 615.6 | 624.8 | 630.6 | 639.8 |
| Pivot points | S3 | S2 | S1 | PP | R1 | R2 | R3 |
|---|---|---|---|---|---|---|---|
| Standard | 587.9 | 604.9 | 613.5 | 630.5 | 639.1 | 656.1 | 664.7 |
| Camarilla | 615.0 | 617.3 | 619.7 | 622.0 | 624.4 | 626.7 | 629.0 |
| Woodie | 583.6 | 602.8 | 609.2 | 628.4 | 634.8 | 654.0 | 660.4 |
| Fibonacci | 604.9 | 614.7 | 620.8 | 630.5 | 640.3 | 646.4 | 656.1 |
| Pivot points | S3 | S2 | S1 | PP | R1 | R2 | R3 |
|---|---|---|---|---|---|---|---|
| Standard | 626.7 | 640.0 | 648.3 | 661.6 | 669.9 | 683.2 | 691.5 |
| Camarilla | 650.8 | 652.7 | 654.7 | 656.7 | 658.7 | 660.7 | 662.6 |
| Woodie | 624.3 | 638.8 | 645.9 | 660.4 | 667.5 | 682.0 | 689.1 |
| Fibonacci | 640.0 | 648.2 | 653.3 | 661.6 | 669.8 | 674.9 | 683.2 |
Numerical data
The following is the status of technical indicators and moving averages registered at the time this technical analysis was created:
| RSI (14): | 28.40 | |
| MACD (12,26,9): | -11.8000 | |
| Directional Movement: | -28.2 | |
| AROON (14): | -64.3 | |
| DEMA (21): | 628.3 | |
| Parabolic SAR (0,02-0,02-0,2): | 653.7 | |
| Elder Ray (13): | -26.1 | |
| Super Trend (3,10): | 644.1 | |
| Zig ZAG (10): | 610.0 | |
| VORTEX (21): | 0.7000 | |
| Stochastique (14,3,5): | 4.80 | |
| TEMA (21): | 617.7 | |
| Williams %R (14): | -93.00 | |
| Chande Momentum Oscillator (20): | -52.0 | |
| Repulse (5,40,3): | -3.0000 | |
| ROCnROLL: | 2 | |
| TRIX (15,9): | -0.1000 | |
| Courbe Coppock: | 11.60 |
| MA7: | 622.6 | |
| MA20: | 647.6 | |
| MA50: | 653.9 | |
| MA100: | 649.9 | |
| MAexp7: | 623.9 | |
| MAexp20: | 640.9 | |
| MAexp50: | 649.3 | |
| MAexp100: | 647.5 | |
| Price / MA7: | -2.30% | |
| Price / MA20: | -6.07% | |
| Price / MA50: | -6.97% | |
| Price / MA100: | -6.40% | |
| Price / MAexp7: | -2.50% | |
| Price / MAexp20: | -5.09% | |
| Price / MAexp50: | -6.31% | |
| Price / MAexp100: | -6.05% |
News
Don"t forget to follow the news on HSBC HOLDINGS ORD 0.50 (UK REG). At the time of publication of this analysis, the latest news was as follows:
- HSBC BANK PLC - Form 8.5 (EPT/RI) - BCA Marketplace plc
- HSBC BANK PLC - Form 8.5 (EPT/RI) - BCA Marketplace plc
- HSBC BANK PLC - Form 8.5 (EPT/RI) - BCA Marketplace plc
- HSBC BANK PLC - Form 8.5 (EPT/RI) - BCA Marketplace plc
- HSBC BANK PLC - Form 8.5 (EPT/RI) - BCA Marketplace plc
About author

Online


Add a comment
Comments
0 comments on the analysis HSBC HOLDINGS ORD USD 0.50 (UK REG) - Daily