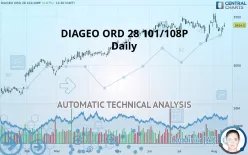
DIAGEO ORD 28 101/108P - Daily - Technical analysis published on 08/12/2019 (GMT)
- 358
- 0
- Who voted?
Click here for a new analysis!
- Timeframe : Daily
- - Analysis generated on
- Status : TARGET REACHED

Summary of the analysis

Additional analysis
Quotes
The DIAGEO ORD 28 101/108P rating is 3,414.5 GBX. On the day, this instrument gained +0.87% with the lowest point at 3,398.0 GBX and the highest point at 3,437.5 GBX. The deviation from the price is +0.49% for the low point and -0.67% for the high point.A bullish opening was detected by the Central Gaps scanner. Buyers are trying to impose a bullish momentum in the very short term.
Bullish opening
Type : Bullish
Timeframe : Openning
A study of price movements over other periods shows the following variations:
Near a new HIGH record (5 years)
Type : Bullish
Timeframe : Weekly
Near a new HIGH record (1 year)
Type : Bullish
Timeframe : Weekly
Near a new HIGH record (1st january)
Type : Bullish
Timeframe : Weekly
Near a new HIGH record (1 month)
Type : Bullish
Timeframe : Weekly
Technical
Technical analysis of this Daily chart of DIAGEO ORD 28 101/108P indicates that the overall trend is strongly bullish. 89.29% of the signals given by moving averages are bullish. The overall trend is supported by the strong bullish signals from short-term moving averages. The Central Indicators scanner detects a bullish signal on moving averages that could impact this trend:
Bullish trend reversal : Moving Average 20
Type : Bullish
Timeframe : Daily
In fact, 13 technical indicators on 18 studied are currently positioned bullish. Central Indicators, the scanner specialised in technical indicators, has identified these signals:
Pivot points : price is over resistance 1
Type : Neutral
Timeframe : Daily
MACD crosses UP its Moving Average
Type : Bullish
Timeframe : Daily
Ichimoku : price is over the cloud
Type : Bullish
Timeframe : Daily
Price is back under the pivot point
Type : Bearish
Timeframe : Weekly
Momentum indicator is back over 0
Type : Bullish
Timeframe : Daily
Central Patterns, the market scanner focusing on chart patterns, resistances and supports found this result:
Horizontal resistance is broken
Type : Bullish
Timeframe : Daily
No result was found by the Central Candlesticks scanner on Japanese candlesticks.
| S3 | S2 | S1 | Price | R1 | |
|---|---|---|---|---|---|
| ProTrendLines | 2,847.1 | 3,239.7 | 3,367.0 | 3,414.5 | 3,482.5 |
| Change (%) | -16.62% | -5.12% | -1.39% | - | +1.99% |
| Change | -567.4 | -174.8 | -47.5 | - | +68.0 |
| Level | Intermediate | Major | Intermediate | - | Major |
Attention could also be paid to pivot points to set price objectives:
| Pivot points | S3 | S2 | S1 | PP | R1 | R2 | R3 |
|---|---|---|---|---|---|---|---|
| Standard | 3,287.8 | 3,314.7 | 3,349.8 | 3,376.7 | 3,411.8 | 3,438.7 | 3,473.8 |
| Camarilla | 3,368.0 | 3,373.6 | 3,379.3 | 3,385.0 | 3,390.7 | 3,396.4 | 3,402.1 |
| Woodie | 3,292.0 | 3,316.8 | 3,354.0 | 3,378.8 | 3,416.0 | 3,440.8 | 3,478.0 |
| Fibonacci | 3,314.7 | 3,338.4 | 3,353.0 | 3,376.7 | 3,400.4 | 3,415.0 | 3,438.7 |
| Pivot points | S3 | S2 | S1 | PP | R1 | R2 | R3 |
|---|---|---|---|---|---|---|---|
| Standard | 3,116.8 | 3,192.3 | 3,267.4 | 3,342.9 | 3,418.0 | 3,493.5 | 3,568.5 |
| Camarilla | 3,301.0 | 3,314.8 | 3,328.6 | 3,342.4 | 3,356.2 | 3,370.0 | 3,383.8 |
| Woodie | 3,116.6 | 3,192.2 | 3,267.1 | 3,342.8 | 3,417.7 | 3,493.4 | 3,568.3 |
| Fibonacci | 3,192.3 | 3,249.9 | 3,285.4 | 3,342.9 | 3,400.4 | 3,436.0 | 3,493.5 |
| Pivot points | S3 | S2 | S1 | PP | R1 | R2 | R3 |
|---|---|---|---|---|---|---|---|
| Standard | 2,991.1 | 3,095.4 | 3,247.8 | 3,352.1 | 3,504.5 | 3,608.9 | 3,761.3 |
| Camarilla | 3,329.6 | 3,353.1 | 3,376.7 | 3,400.2 | 3,423.7 | 3,447.3 | 3,470.8 |
| Woodie | 3,015.1 | 3,107.4 | 3,271.8 | 3,364.2 | 3,528.6 | 3,620.9 | 3,785.3 |
| Fibonacci | 3,095.4 | 3,193.5 | 3,254.1 | 3,352.1 | 3,450.2 | 3,510.8 | 3,608.9 |
Numerical data
The following is the status of technical indicators and moving averages registered at the time this technical analysis was created:
| RSI (14): | 55.40 | |
| MACD (12,26,9): | 7.3000 | |
| Directional Movement: | 7.8 | |
| AROON (14): | 42.8 | |
| DEMA (21): | 3,374.9 | |
| Parabolic SAR (0,02-0,02-0,2): | 3,304.6 | |
| Elder Ray (13): | 48.0 | |
| Super Trend (3,10): | 3,256.5 | |
| Zig ZAG (10): | 3,414.0 | |
| VORTEX (21): | 1.0000 | |
| Stochastique (14,3,5): | 63.90 | |
| TEMA (21): | 3,372.3 | |
| Williams %R (14): | -26.00 | |
| Chande Momentum Oscillator (20): | 216.3 | |
| Repulse (5,40,3): | 0.7000 | |
| ROCnROLL: | 1 | |
| TRIX (15,9): | 0.0000 | |
| Courbe Coppock: | 2.50 |
| MA7: | 3,364.4 | |
| MA20: | 3,358.5 | |
| MA50: | 3,361.2 | |
| MA100: | 3,263.0 | |
| MAexp7: | 3,377.0 | |
| MAexp20: | 3,366.1 | |
| MAexp50: | 3,337.9 | |
| MAexp100: | 3,249.6 | |
| Price / MA7: | +1.49% | |
| Price / MA20: | +1.67% | |
| Price / MA50: | +1.59% | |
| Price / MA100: | +4.64% | |
| Price / MAexp7: | +1.11% | |
| Price / MAexp20: | +1.44% | |
| Price / MAexp50: | +2.29% | |
| Price / MAexp100: | +5.07% |
About author

Online


Add a comment
Comments
0 comments on the analysis DIAGEO ORD 28 101/108P - Daily