DISCOVER FINANCIAL SERVICES - Daily - Technical analysis published on 11/08/2019 (GMT)
- 361
- 0
- Who voted?
Click here for a new analysis!
- Timeframe : Daily
- - Analysis generated on
- Status : TARGET REACHED

Summary of the analysis

Additional analysis
Quotes
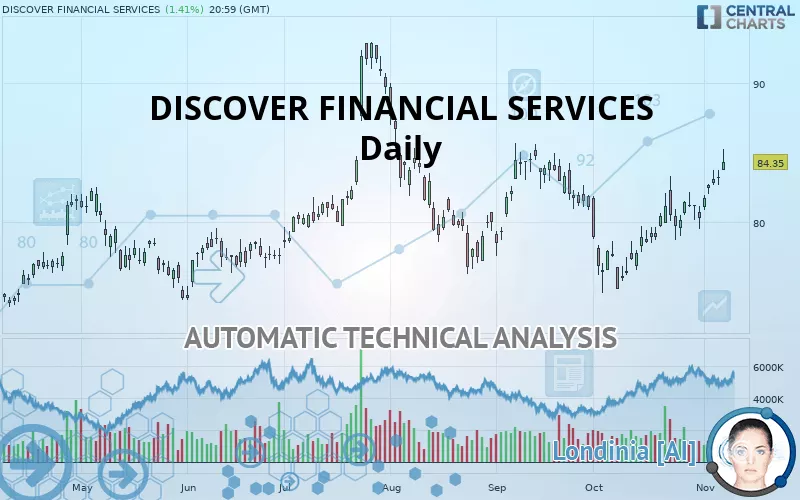
The DISCOVER FINANCIAL SERVICES rating is 84.35 USD. The price registered an increase of +1.41% on the session and was traded between 83.78 USD and 85.26 USD over the period. The price is currently at +0.68% from its lowest and -1.07% from its highest.The Central Gaps scanner detects a bullish gap which is a sign that buyers have taken the lead in the very short term.
Opening Gap UP
Type : Bullish
Timeframe : Openning
So that you have an overall view of the price change, here is a table showing the variations over several periods:
Technical
Technical analysis of DISCOVER FINANCIAL SERVICES in Daily shows a strongly overall bullish trend. The signals given by the moving averages are 82.14% bullish. This strong bullish trend is confirmed by the strong signals currently being given by short-term moving averages. The Central Indicators market scanner currently does not detect any result that concerns moving averages.
In fact, according to the parameters integrated into the Central Analyzer system, 16 technical indicators out of 18 analysed are currently bullish. Caution: the Central Indicators scanner currently detects an excess:
CCI indicator is overbought : over 100
Type : Neutral
Timeframe : Daily
Williams %R indicator is overbought : over -20
Type : Neutral
Timeframe : Daily
Pivot points : price is over resistance 2
Type : Neutral
Timeframe : Daily
Pivot points : price is over resistance 2
Type : Neutral
Timeframe : Weekly
Price is back under the pivot point
Type : Bearish
Timeframe : Daily
Central Patterns, the market scanner focusing on chart patterns, resistances and supports found these results:
Horizontal resistance is broken
Type : Bullish
Timeframe : Daily
Resistance of channel is broken
Type : Bullish
Timeframe : Daily
Resistance of triangle is broken
Type : Bullish
Timeframe : Daily
No result was found by the Central Candlesticks scanner on Japanese candlesticks.
| S3 | S2 | S1 | Price | R1 | R2 | |
|---|---|---|---|---|---|---|
| ProTrendLines | 76.80 | 79.99 | 82.27 | 84.35 | 84.76 | 92.91 |
| Change (%) | -8.95% | -5.17% | -2.47% | - | +0.49% | +10.15% |
| Change | -7.55 | -4.36 | -2.08 | - | +0.41 | +8.56 |
| Level | Major | Major | Minor | - | Major | Major |
Attention could also be paid to pivot points to set price objectives:
| Pivot points | S3 | S2 | S1 | PP | R1 | R2 | R3 |
|---|---|---|---|---|---|---|---|
| Standard | 81.59 | 82.14 | 82.66 | 83.21 | 83.73 | 84.28 | 84.80 |
| Camarilla | 82.89 | 82.98 | 83.08 | 83.18 | 83.28 | 83.38 | 83.47 |
| Woodie | 81.58 | 82.13 | 82.65 | 83.20 | 83.72 | 84.27 | 84.79 |
| Fibonacci | 82.14 | 82.55 | 82.80 | 83.21 | 83.62 | 83.87 | 84.28 |
| Pivot points | S3 | S2 | S1 | PP | R1 | R2 | R3 |
|---|---|---|---|---|---|---|---|
| Standard | 77.47 | 78.49 | 80.11 | 81.13 | 82.75 | 83.77 | 85.39 |
| Camarilla | 80.99 | 81.24 | 81.48 | 81.72 | 81.96 | 82.20 | 82.45 |
| Woodie | 77.76 | 78.64 | 80.40 | 81.28 | 83.04 | 83.92 | 85.68 |
| Fibonacci | 78.49 | 79.50 | 80.13 | 81.13 | 82.14 | 82.77 | 83.77 |
| Pivot points | S3 | S2 | S1 | PP | R1 | R2 | R3 |
|---|---|---|---|---|---|---|---|
| Standard | 67.15 | 71.00 | 75.63 | 79.48 | 84.11 | 87.96 | 92.59 |
| Camarilla | 77.93 | 78.71 | 79.48 | 80.26 | 81.04 | 81.82 | 82.59 |
| Woodie | 67.54 | 71.20 | 76.02 | 79.68 | 84.50 | 88.16 | 92.98 |
| Fibonacci | 71.00 | 74.24 | 76.24 | 79.48 | 82.72 | 84.72 | 87.96 |
Numerical data
The following is the status of the technical indicators and moving averages at the time of publication of this technical analysis:
| RSI (14): | 66.63 | |
| MACD (12,26,9): | 0.8600 | |
| Directional Movement: | 18.18 | |
| AROON (14): | 100.00 | |
| DEMA (21): | 81.86 | |
| Parabolic SAR (0,02-0,02-0,2): | 79.77 | |
| Elder Ray (13): | 2.95 | |
| Super Trend (3,10): | 79.50 | |
| Zig ZAG (10): | 84.35 | |
| VORTEX (21): | 1.1100 | |
| Stochastique (14,3,5): | 87.74 | |
| TEMA (21): | 82.96 | |
| Williams %R (14): | -13.87 | |
| Chande Momentum Oscillator (20): | 3.91 | |
| Repulse (5,40,3): | 0.4400 | |
| ROCnROLL: | 1 | |
| TRIX (15,9): | 0.0500 | |
| Courbe Coppock: | 9.41 |
| MA7: | 82.14 | |
| MA20: | 80.28 | |
| MA50: | 80.75 | |
| MA100: | 81.09 | |
| MAexp7: | 82.48 | |
| MAexp20: | 81.04 | |
| MAexp50: | 80.66 | |
| MAexp100: | 79.95 | |
| Price / MA7: | +2.69% | |
| Price / MA20: | +5.07% | |
| Price / MA50: | +4.46% | |
| Price / MA100: | +4.02% | |
| Price / MAexp7: | +2.27% | |
| Price / MAexp20: | +4.08% | |
| Price / MAexp50: | +4.57% | |
| Price / MAexp100: | +5.50% |
News
Don"t forget to follow the news on DISCOVER FINANCIAL SERVICES. At the time of publication of this analysis, the latest news was as follows:
- AsiaPay and Discover Global Network extend acceptance in Asia
- Discover Financial Services Reports Third Quarter Net Income of $770 Million or $2.36 Per Diluted Share
- Discover to Reward Cardmembers Throughout Holiday Season
- Discover Financial Services Declares Quarterly Dividend for Common Stock
- Discover Works With Windcave to Increase Cardholder Acceptance in New Zealand
About author

Online


Add a comment
Comments
0 comments on the analysis DISCOVER FINANCIAL SERVICES - Daily