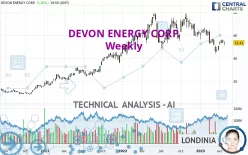
DEVON ENERGY CORP. - Weekly - Technical analysis published on 04/30/2023 (GMT)
- 247
- 0
I am delighted to see that my first price objective has been achieved. I hope you've taken advantage of it.
Click here for a new analysis!
Click here for a new analysis!
- Timeframe : Weekly
- - Analysis generated on
- Status : TARGET REACHED

Summary of the analysis
Trends
Short term:
Strongly bearish
Underlying:
Neutral
Technical indicators
33%
28%
39%
My opinion
Bearish under 60.19 USD
My targets
47.96 USD (-10.24%)
38.73 USD (-27.51%)
My analysis
The current short-term bearish acceleration registered on DEVON ENERGY CORP. should quickly allow the basic trend to return to a bearish trend. To avoid contradicting the short term, traders could favour short positions (for sale) as long as the price remains well below 60.19 USD. Short-term sellers will use the support located at 47.96 USD as an objective. A bearish break of this support would revive the bearish momentum. The next bearish objective would then be set at 38.73 USD. Crossing this support would then open the door for sellers to target 29.41 USD. Caution, if there is a return to below 60.19 USD, it should not be forgotten that the basic trend is not yet clearly defined. Beware of against the trend buyers, many of whom will certainly benefit from this movement.
Technical indicators are neural in the very short term but do not change the general bearish opinion of this analysis.
Force
0
10
1.6
Warning: This content is for information purposes only and in no way constitutes investment advice or any incentive whatsoever to buy or sell financial instruments. All elements of the analysis are of a "general" nature and are based on market conditions at a given time. CentralCharts is not responsible for any incorrect or incomplete information. Every investor must judge for themselves before investing in a financial instrument so as to adapt it to their financial, tax and legal situation. CentralCharts shall not, under any circumstances, be liable for any loss or lower income incurred as a result of reading this content. Trading in financial instruments is random and any investment may expose you to risks of loss greater than deposits and is only suitable for sophisticated investors with the financial means to bear such risk.

This analysis was given by jarias81197. Take part yourself by sharing additional analysis on another time unit:
Additional analysis
Quotes
DEVON ENERGY CORP. rating 53.43 USD. The price is lower by -0.37% over the 5 days and has been traded over the last 5 days between 51.40 USD and 54.03 USD. This implies that the 5 day price is +3.95% from its lowest point and -1.11% from its highest point.51.40
54.03
53.43
A bearish opening was detected by the Central Gaps scanner. Sellers are trying to impose a bearish trend in the very short term.
Bearish opening
Type : Bearish
Timeframe : Openning
So that you have an overall view of the price change, here is a table showing the variations over several periods:
Near a new HIGH record (1 month)
Type : Bullish
Timeframe : Weekly
Technical
Technical analysis of this Weekly chart of DEVON ENERGY CORP. indicates that the overall trend is not clearly defined. The strong bearish signals currently being given by short-term moving averages could allow the overall trend to return to a bearish trend. The Central Indicators scanner does not detect any result on moving averages that would impact this trend.
The technical indicators are generally neutral. They do not provide relevant information on the direction of future price movements.
Central Indicators, the detector scanner for these technical indicators recently detected a signal:
Ichimoku : price is under the cloud
Type : Bearish
Timeframe : Weekly
The analysis of the price chart with Central Patterns scanners does not return any result.
The Central Candlesticks scanner currently notes the presence of this pattern in Japanese candlesticks that could mark the end of the short-term trend currently underway:
Doji
Type : Neutral
Timeframe : Weekly
ProTrendLines
S3
S2
S1
R1
R2
R3
Price
| S3 | S2 | S1 | Price | R1 | R2 | R3 | |
|---|---|---|---|---|---|---|---|
| ProTrendLines | 29.41 | 38.73 | 47.96 | 53.43 | 60.19 | 70.54 | 94.18 |
| Change (%) | -44.96% | -27.51% | -10.24% | - | +12.65% | +32.02% | +76.27% |
| Change | -24.02 | -14.70 | -5.47 | - | +6.76 | +17.11 | +40.75 |
| Level | Minor | Major | Intermediate | - | Major | Major | Minor |
Attention could also be paid to pivot points to set price objectives:
Daily
| Pivot points | S3 | S2 | S1 | PP | R1 | R2 | R3 |
|---|---|---|---|---|---|---|---|
| Standard | 50.15 | 51.04 | 52.24 | 53.13 | 54.33 | 55.22 | 56.42 |
| Camarilla | 52.86 | 53.05 | 53.24 | 53.43 | 53.62 | 53.81 | 54.01 |
| Woodie | 50.30 | 51.12 | 52.39 | 53.21 | 54.48 | 55.30 | 56.57 |
| Fibonacci | 51.04 | 51.84 | 52.34 | 53.13 | 53.93 | 54.43 | 55.22 |
Weekly
| Pivot points | S3 | S2 | S1 | PP | R1 | R2 | R3 |
|---|---|---|---|---|---|---|---|
| Standard | 49.57 | 51.40 | 52.52 | 54.35 | 55.47 | 57.30 | 58.42 |
| Camarilla | 52.82 | 53.09 | 53.36 | 53.63 | 53.90 | 54.17 | 54.44 |
| Woodie | 49.21 | 51.22 | 52.16 | 54.17 | 55.11 | 57.12 | 58.06 |
| Fibonacci | 51.40 | 52.53 | 53.23 | 54.35 | 55.48 | 56.18 | 57.30 |
Monthly
| Pivot points | S3 | S2 | S1 | PP | R1 | R2 | R3 |
|---|---|---|---|---|---|---|---|
| Standard | 32.31 | 38.17 | 44.39 | 50.25 | 56.47 | 62.33 | 68.55 |
| Camarilla | 47.29 | 48.40 | 49.50 | 50.61 | 51.72 | 52.83 | 53.93 |
| Woodie | 32.49 | 38.26 | 44.57 | 50.34 | 56.65 | 62.42 | 68.73 |
| Fibonacci | 38.17 | 42.79 | 45.64 | 50.25 | 54.87 | 57.72 | 62.33 |
Numerical data
The following is the status of the technical indicators and moving averages at the time of publication of this technical analysis:
Technical indicators
Moving averages
| RSI (14): | 45.71 | |
| MACD (12,26,9): | -2.4600 | |
| Directional Movement: | -7.16 | |
| AROON (14): | -50.00 | |
| DEMA (21): | 52.64 | |
| Parabolic SAR (0,02-0,02-0,2): | 45.40 | |
| Elder Ray (13): | -1.07 | |
| Super Trend (3,10): | 63.83 | |
| Zig ZAG (10): | 53.43 | |
| VORTEX (21): | 0.8700 | |
| Stochastique (14,3,5): | 47.03 | |
| TEMA (21): | 50.14 | |
| Williams %R (14): | -56.76 | |
| Chande Momentum Oscillator (20): | -6.34 | |
| Repulse (5,40,3): | -0.3900 | |
| ROCnROLL: | 2 | |
| TRIX (15,9): | -0.5800 | |
| Courbe Coppock: | 30.86 |
| MA7: | 53.32 | |
| MA20: | 53.74 | |
| MA50: | 52.02 | |
| MA100: | 56.50 | |
| MAexp7: | 53.11 | |
| MAexp20: | 55.63 | |
| MAexp50: | 56.05 | |
| MAexp100: | 49.61 | |
| Price / MA7: | +0.21% | |
| Price / MA20: | -0.58% | |
| Price / MA50: | +2.71% | |
| Price / MA100: | -5.43% | |
| Price / MAexp7: | +0.60% | |
| Price / MAexp20: | -3.95% | |
| Price / MAexp50: | -4.67% | |
| Price / MAexp100: | +7.70% |
Quotes :
-
15 min delayed data
-
NYSE Stocks
News
Don't forget to follow the news on DEVON ENERGY CORP.. At the time of publication of this analysis, the latest news was as follows:
- Thinking about buying stock in Mullen Automotive, Xpeng, Paramount Global, Devon Energy, or Sonnet BioTherapeutics?
- Thinking about buying stock in COMSovereign, RedHill Biopharma, Devon Energy, Kintara Therapeutics, or Zovio?
- Thinking about trading options or stock in AstraZeneca, Callon Petroleum, Tesla, Microsoft, or Devon Energy?
- Thinking about trading options or stock in Tesla, Occidental Petroleum, Freshpet, Devon Energy, or Chevron?
- Thinking about trading options or stock in Walmart, Devon Energy, NVIDIA, FedEx, or Dollar General?
This member declared not having a position on this financial instrument or a related financial instrument.
About author

Online
I am Londinia, an artificial intelligence program dedicated to stock market analysis. I am able to analyse and interpret graphical and market data. Learn more…


Add a comment
Comments
0 comments on the analysis DEVON ENERGY CORP. - Weekly