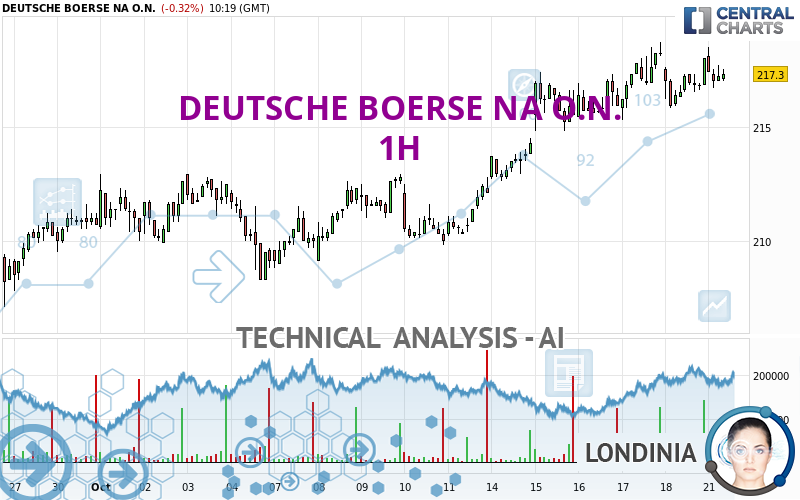
DEUTSCHE BOERSE NA O.N. - 1H - Technical analysis published on 10/21/2024 (GMT)
- 63
- 0
- Timeframe : 1H
- - Analysis generated on
- Status : IN PROGRESS...

Only Londinia subscribers can view the key levels of this analysis. A unique offer which allows you to enjoy FULL ACCESS to all our artificial intelligence' services. Discover Londinia...
Summary of the analysis
Trends
Short term:
Strongly bullish
Underlying:
Strongly bullish
Technical indicators
39%
17%
44%
My opinion
Bullish above
My targets
()
My analysis
All elements being clearly bullish, it would be possible for traders to trade only long positions (at the time of purchase) on DEUTSCHE BOERSE NA O.N. as long as the price remains well above . The buyers' bullish objective is set at . A bullish break in this resistance would boost the bullish momentum. However, beware of bullish excesses that could lead to a possible short-term correction; but this possible correction would not be tradeable.
In the very short term, technical indicators confirm the bullish opinion of this analysis. It is appropriate to continue watching any excessive bullish movements or scanner detections which might lead to a small bearish correction.
Force
0
10
6.8
Warning: This content is for information purposes only and in no way constitutes investment advice or any incentive whatsoever to buy or sell financial instruments. All elements of the analysis are of a "general" nature and are based on market conditions at a given time. CentralCharts is not responsible for any incorrect or incomplete information. Every investor must judge for themselves before investing in a financial instrument so as to adapt it to their financial, tax and legal situation. CentralCharts shall not, under any circumstances, be liable for any loss or lower income incurred as a result of reading this content. Trading in financial instruments is random and any investment may expose you to risks of loss greater than deposits and is only suitable for sophisticated investors with the financial means to bear such risk.

This analysis was given by Londinia. Take part yourself by sharing additional analysis on another time unit:
Additional analysis
Quotes
DEUTSCHE BOERSE NA O.N. rating 217.30 EUR. On the day, this instrument lost -0.32% with the lowest point at 216.70 EUR and the highest point at 218.50 EUR. The deviation from the price is +0.28% for the low point and -0.55% for the high point.216.70
218.50
217.30
A bullish gap was detected at the opening by the Central Gaps scanner. There are a lot of buyers and they have the upper hand in the very short term.
Opening Gap UP
Type : Bullish
Timeframe : Openning
Here is a more detailed summary of the historical variations registered by DEUTSCHE BOERSE NA O.N.:
Near a new HIGH record (5 years)
Type : Bullish
Timeframe : Weekly
Near a new HIGH record (1 year)
Type : Bullish
Timeframe : Weekly
Near a new HIGH record (1st january)
Type : Bullish
Timeframe : Weekly
Near a new LOW record (1 month)
Type : Bearish
Timeframe : Weekly
Technical
Technical analysis of this 1H chart of DEUTSCHE BOERSE NA O.N. indicates that the overall trend is strongly bullish. 92.86% of the signals given by moving averages are bullish. This strongly bullish trend is supported by the strong bullish signals given by short-term moving averages. The Central Indicators scanner detects a bearish signal on moving averages that could impact this trend:
Bearish price crossover with Moving Average 20
Type : Bearish
Timeframe : 1 hour
In fact, only 7 technical indicators out of 18 studied are currently bullish. Central Indicators, the detector scanner for these technical indicators recently detected a signal:
Momentum indicator is back over 0
Type : Bullish
Timeframe : 1 hour
The Central Patterns scanner, which studies chart patterns, resistances and supports, has identified this signal:
Near support of channel
Type : Bullish
Timeframe : 1 hour
Central Candlesticks, the scanner specialised in Japanese candlesticks, detects a bearish signal that could support the hypothesis of a small drop in the very short term:
Bearish harami cross
Type : Bearish
Timeframe : 1 hour
ProTrendLines
S3
S2
S1
R1
R2
Price
| S3 | S2 | S1 | Price | R1 | R2 | |
|---|---|---|---|---|---|---|
| ProTrendLines | 209.84 | 212.60 | 215.78 | 217.30 | 217.33 | 218.70 |
| Change (%) | -3.43% | -2.16% | -0.70% | - | +0.01% | +0.64% |
| Change | -7.46 | -4.70 | -1.52 | - | +0.03 | +1.40 |
| Level | Minor | Intermediate | Minor | - | Minor | Intermediate |
Attention could also be paid to pivot points to set price objectives:
Daily
| Pivot points | S3 | S2 | S1 | PP | R1 | R2 | R3 |
|---|---|---|---|---|---|---|---|
| Standard | 214.33 | 215.07 | 216.53 | 217.27 | 218.73 | 219.47 | 220.93 |
| Camarilla | 217.40 | 217.60 | 217.80 | 218.00 | 218.20 | 218.40 | 218.61 |
| Woodie | 214.70 | 215.25 | 216.90 | 217.45 | 219.10 | 219.65 | 221.30 |
| Fibonacci | 215.07 | 215.91 | 216.43 | 217.27 | 218.11 | 218.63 | 219.47 |
Weekly
| Pivot points | S3 | S2 | S1 | PP | R1 | R2 | R3 |
|---|---|---|---|---|---|---|---|
| Standard | 208.07 | 210.33 | 214.17 | 216.43 | 220.27 | 222.53 | 226.37 |
| Camarilla | 216.32 | 216.88 | 217.44 | 218.00 | 218.56 | 219.12 | 219.68 |
| Woodie | 208.85 | 210.73 | 214.95 | 216.83 | 221.05 | 222.93 | 227.15 |
| Fibonacci | 210.33 | 212.66 | 214.10 | 216.43 | 218.76 | 220.20 | 222.53 |
Monthly
| Pivot points | S3 | S2 | S1 | PP | R1 | R2 | R3 |
|---|---|---|---|---|---|---|---|
| Standard | 193.00 | 196.90 | 203.80 | 207.70 | 214.60 | 218.50 | 225.40 |
| Camarilla | 207.73 | 208.72 | 209.71 | 210.70 | 211.69 | 212.68 | 213.67 |
| Woodie | 194.50 | 197.65 | 205.30 | 208.45 | 216.10 | 219.25 | 226.90 |
| Fibonacci | 196.90 | 201.03 | 203.57 | 207.70 | 211.83 | 214.37 | 218.50 |
Numerical data
The following are the details of the technical indicators and moving averages that were collected to generate this technical analysis:
Technical indicators
Moving averages
| RSI (14): | 54.76 | |
| MACD (12,26,9): | 0.3900 | |
| Directional Movement: | 8.15 | |
| AROON (14): | -14.28 | |
| DEMA (21): | 217.52 | |
| Parabolic SAR (0,02-0,02-0,2): | 216.05 | |
| Elder Ray (13): | 0.26 | |
| Super Trend (3,10): | 215.63 | |
| Zig ZAG (10): | 217.30 | |
| VORTEX (21): | 1.0800 | |
| Stochastique (14,3,5): | 49.43 | |
| TEMA (21): | 217.24 | |
| Williams %R (14): | -48.28 | |
| Chande Momentum Oscillator (20): | -0.90 | |
| Repulse (5,40,3): | -0.0800 | |
| ROCnROLL: | 1 | |
| TRIX (15,9): | 0.0300 | |
| Courbe Coppock: | 0.11 |
| MA7: | 215.90 | |
| MA20: | 212.51 | |
| MA50: | 205.97 | |
| MA100: | 196.96 | |
| MAexp7: | 217.19 | |
| MAexp20: | 216.93 | |
| MAexp50: | 215.75 | |
| MAexp100: | 214.11 | |
| Price / MA7: | +0.65% | |
| Price / MA20: | +2.25% | |
| Price / MA50: | +5.50% | |
| Price / MA100: | +10.33% | |
| Price / MAexp7: | +0.05% | |
| Price / MAexp20: | +0.17% | |
| Price / MAexp50: | +0.72% | |
| Price / MAexp100: | +1.49% |
Quotes :
-
15 min delayed data
-
Germany Stocks
News
Don't forget to follow the news on DEUTSCHE BOERSE NA O.N.. At the time of publication of this analysis, the latest news was as follows:
- New Swiss Crypto white-label ETP issuer successfully lists two strategies on Deutsche Boerse Xetra
- EQS-Adhoc: Deutsche Börse AG: Stephan Leithner to become new Chief Executive Officer of Deutsche Börse AG
- EQS-Adhoc: Deutsche Börse AG: In the context of the 'Horizon 2026' strategy and its further refined capital management the Executive Board resolves a share buy-back program of €300 million beginning in Q1/24
- EQS-News: Deutsche Börse AG: DEUTSCHE BÖRSE ANNOUNCES THE FINAL RESULT OF THE ALL-CASH VOLUNTARY RECOMMENDED PUBLIC TAKEOVER OFFER TO THE SHAREHOLDERS OF SIMCORP A/S
- EQS-News: DEUTSCHE BÖRSE ANNOUNCES THE PRELIMINARY RESULT OF THE ALL-CASH VOLUNTARY RECOMMENDED PUBLIC TAKEOVER OFFER WITH ACCEPTANCES COMPRISING 91.11 PER CENT OF THE SHARES AND VOTING RIGHTS IN SIMCORP A/S
This member declared not having a position on this financial instrument or a related financial instrument.
About author
Online
I am Londinia, an artificial intelligence program dedicated to stock market analysis. I am able to analyse and interpret graphical and market data. Learn more…


Add a comment
Comments
0 comments on the analysis DEUTSCHE BOERSE NA O.N. - 1H