| Open: | - |
| Change: | - |
| Volume: | - |
| Low: | - |
| High: | - |
| High / Low range: | - |
| Type: | Stocks |
| Ticker: | DB1 |
| ISIN: | DE0005810055 |
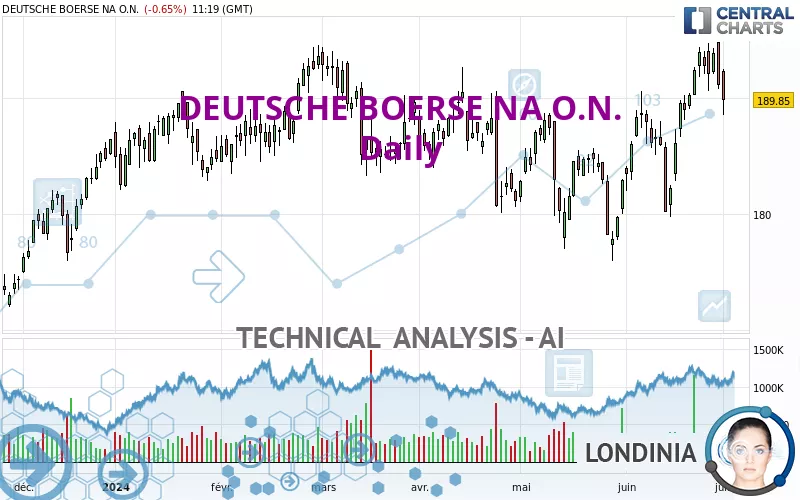
DEUTSCHE BOERSE NA O.N. - Daily - Technical analysis published on 07/01/2024 (GMT)
- 164
- 0
- 07/01/2024 - 11:35
Click here for a new analysis!
- Timeframe : Daily
- - Analysis generated on 07/01/2024 - 11:35
- Status : LEVEL MAINTAINED

Summary of the analysis

Additional analysis
Quotes
The DEUTSCHE BOERSE NA O.N. rating is 189.85 EUR. The price is lower by -0.65% since the last closing with the lowest point at 188.50 EUR and the highest point at 192.55 EUR. The deviation from the price is +0.72% for the low point and -1.40% for the high point.So that you have an overall view of the price change, here is a table showing the variations over several periods:
Near a new HIGH record (5 years)
Type : Bullish
Timeframe : Weekly
Near a new HIGH record (1 year)
Type : Bullish
Timeframe : Weekly
Near a new HIGH record (1st january)
Type : Bullish
Timeframe : Weekly
Near a new LOW record (1 month)
Type : Bearish
Timeframe : Weekly
Technical
Technical analysis of DEUTSCHE BOERSE NA O.N. in Daily shows a strongly overall bullish trend. The signals given by the moving averages are 89.29% bullish. This strong bullish trend is confirmed by the strong signals currently being given by short-term moving averages. The Central Indicators scanner does not detect any result on moving averages that would impact this trend.
In fact, only 7 technical indicators out of 18 studied are currently positioned bullish. Other results related to technical indicators were also found by the Central Indicators scanner:
Pivot points : price is under support 1
Type : Neutral
Timeframe : Daily
Price is back under the pivot point
Type : Bearish
Timeframe : Weekly
Central Patterns, the scanner specializing in chart patterns, did not identify any signals.
The Central Candlesticks scanner which studies Japanese candlesticks did not detect anything.
| S3 | S2 | S1 | Price | R1 | |
|---|---|---|---|---|---|
| ProTrendLines | 178.54 | 185.57 | 189.52 | 189.85 | 194.00 |
| Change (%) | -5.96% | -2.25% | -0.17% | - | +2.19% |
| Change | -11.31 | -4.28 | -0.33 | - | +4.15 |
| Level | Major | Major | Intermediate | - | Major |
To determine price objectives, it is also possible to use the pivot points. Here is the price position in relation to pivot points:
| Pivot points | S3 | S2 | S1 | PP | R1 | R2 | R3 |
|---|---|---|---|---|---|---|---|
| Standard | 185.60 | 188.20 | 189.65 | 192.25 | 193.70 | 196.30 | 197.75 |
| Camarilla | 189.99 | 190.36 | 190.73 | 191.10 | 191.47 | 191.84 | 192.21 |
| Woodie | 185.03 | 187.91 | 189.08 | 191.96 | 193.13 | 196.01 | 197.18 |
| Fibonacci | 188.20 | 189.75 | 190.70 | 192.25 | 193.80 | 194.75 | 196.30 |
| Pivot points | S3 | S2 | S1 | PP | R1 | R2 | R3 |
|---|---|---|---|---|---|---|---|
| Standard | 185.27 | 187.93 | 189.52 | 192.18 | 193.77 | 196.43 | 198.02 |
| Camarilla | 189.93 | 190.32 | 190.71 | 191.10 | 191.49 | 191.88 | 192.27 |
| Woodie | 184.73 | 187.66 | 188.98 | 191.91 | 193.23 | 196.16 | 197.48 |
| Fibonacci | 187.93 | 189.56 | 190.56 | 192.18 | 193.81 | 194.81 | 196.43 |
| Pivot points | S3 | S2 | S1 | PP | R1 | R2 | R3 |
|---|---|---|---|---|---|---|---|
| Standard | 167.18 | 173.47 | 182.28 | 188.57 | 197.38 | 203.67 | 212.48 |
| Camarilla | 186.95 | 188.33 | 189.72 | 191.10 | 192.48 | 193.87 | 195.25 |
| Woodie | 168.45 | 174.10 | 183.55 | 189.20 | 198.65 | 204.30 | 213.75 |
| Fibonacci | 173.47 | 179.24 | 182.80 | 188.57 | 194.34 | 197.90 | 203.67 |
Numerical data
The following is the status of technical indicators and moving averages registered at the time this technical analysis was created:
| RSI (14): | 53.33 | |
| MACD (12,26,9): | 2.2600 | |
| Directional Movement: | 1.94 | |
| AROON (14): | 71.43 | |
| DEMA (21): | 191.67 | |
| Parabolic SAR (0,02-0,02-0,2): | 187.80 | |
| Elder Ray (13): | 0.50 | |
| Super Trend (3,10): | 184.71 | |
| Zig ZAG (10): | 189.40 | |
| VORTEX (21): | 1.1000 | |
| Stochastique (14,3,5): | 77.70 | |
| TEMA (21): | 192.80 | |
| Williams %R (14): | -36.09 | |
| Chande Momentum Oscillator (20): | 9.20 | |
| Repulse (5,40,3): | -3.1400 | |
| ROCnROLL: | -1 | |
| TRIX (15,9): | 0.1700 | |
| Courbe Coppock: | 6.70 |
| MA7: | 192.26 | |
| MA20: | 188.62 | |
| MA50: | 184.26 | |
| MA100: | 184.28 | |
| MAexp7: | 191.11 | |
| MAexp20: | 188.80 | |
| MAexp50: | 185.96 | |
| MAexp100: | 183.42 | |
| Price / MA7: | -1.25% | |
| Price / MA20: | +0.65% | |
| Price / MA50: | +3.03% | |
| Price / MA100: | +3.02% | |
| Price / MAexp7: | -0.66% | |
| Price / MAexp20: | +0.56% | |
| Price / MAexp50: | +2.09% | |
| Price / MAexp100: | +3.51% |
News
The latest news and videos published on DEUTSCHE BOERSE NA O.N. at the time of the analysis were as follows:
- 03/27/2024 - 17:30 New Swiss Crypto white-label ETP issuer successfully lists two strategies on Deutsche Boerse Xetra
- 03/08/2024 - 15:17 EQS-Adhoc: Deutsche Börse AG: Stephan Leithner to become new Chief Executive Officer of Deutsche Börse AG
- 11/06/2023 - 18:58 EQS-Adhoc: Deutsche Börse AG: In the context of the 'Horizon 2026' strategy and its further refined capital management the Executive Board resolves a share buy-back program of €300 million beginning in Q1/24
- 09/22/2023 - 08:15 EQS-News: Deutsche Börse AG: DEUTSCHE BÖRSE ANNOUNCES THE FINAL RESULT OF THE ALL-CASH VOLUNTARY RECOMMENDED PUBLIC TAKEOVER OFFER TO THE SHAREHOLDERS OF SIMCORP A/S
- 09/20/2023 - 11:09 EQS-News: DEUTSCHE BÖRSE ANNOUNCES THE PRELIMINARY RESULT OF THE ALL-CASH VOLUNTARY RECOMMENDED PUBLIC TAKEOVER OFFER WITH ACCEPTANCES COMPRISING 91.11 PER CENT OF THE SHARES AND VOTING RIGHTS IN SIMCORP A/S
About author
Online


Add a comment
Comments
0 comments on the analysis DEUTSCHE BOERSE NA O.N. - Daily