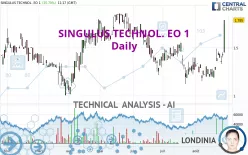
SINGULUS TECHNOL. EO 1 - Daily - Technical analysis published on 08/28/2024 (GMT)
- 133
- 0
Click here for a new analysis!
- Timeframe : Daily
- - Analysis generated on
- Status : INVALID

Summary of the analysis

Additional analysis
Quotes
The SINGULUS TECHNOL. EO 1 rating is 1.785 EUR. On the day, this instrument gained +25.70% and was between 1.450 EUR and 1.785 EUR. This implies that the price is at +23.10% from its lowest and at 0% from its highest.Here is a more detailed summary of the historical variations registered by SINGULUS TECHNOL. EO 1:
New HIGH record (1 month)
Type : Bullish
Timeframe : Weekly
The Central Volumes scanner detects abnormal volumes on the asset:
Abnormal volumes
Timeframe : 5 days
Technical
A technical analysis in Daily of this SINGULUS TECHNOL. EO 1 chart shows a bullish trend. 71.43% of the signals given by moving averages are bullish. This bullish trend is supported by the strong bullish signals given by short-term moving averages. An assessment of moving averages reveals several bullish signals that could impact this trend:
Moving Average bullish crossovers : AMA20 & AMA50
Type : Bullish
Timeframe : Daily
Bullish price crossover with Moving Average 100
Type : Bullish
Timeframe : Daily
Technical indicators are strongly bullish, suggesting that the price increase should continue.
Caution: the Central Indicators scanner currently detects an excess:
RSI indicator is overbought : over 70
Type : Neutral
Timeframe : Daily
CCI indicator is overbought : over 100
Type : Neutral
Timeframe : Daily
Williams %R indicator is overbought : over -20
Type : Neutral
Timeframe : Daily
Pivot points : price is over resistance 1
Type : Neutral
Timeframe : Weekly
Pivot points : price is over resistance 3
Type : Neutral
Timeframe : Daily
Ichimoku : price is over the cloud
Type : Bullish
Timeframe : Daily
SuperTrend indicator bullish reversal
Type : Bullish
Timeframe : Daily
The Central Patterns scanner, which studies chart patterns, resistances and supports, has identified these signals:
Horizontal resistance is broken
Type : Bullish
Timeframe : Daily
Resistance of channel is broken
Type : Bullish
Timeframe : Daily
Central Candlesticks, the scanner specialised in Japanese candlesticks, detects these bullish signals that could support the hypothesis of a small rebound in the very short term:
White marubozu
Type : Bullish
Timeframe : Daily
Long white line
Type : Bullish
Timeframe : Daily
| S3 | S2 | S1 | Price | R1 | R2 | R3 | |
|---|---|---|---|---|---|---|---|
| ProTrendLines | 1.283 | 1.589 | 1.701 | 1.785 | 1.838 | 3.284 | 5.999 |
| Change (%) | -28.12% | -10.98% | -4.71% | - | +2.97% | +83.98% | +236.08% |
| Change | -0.502 | -0.196 | -0.084 | - | +0.053 | +1.499 | +4.214 |
| Level | Intermediate | Minor | Minor | - | Major | Intermediate | Intermediate |
To determine price objectives, it is also possible to use the pivot points. Here is the price position in relation to pivot points:
| Pivot points | S3 | S2 | S1 | PP | R1 | R2 | R3 |
|---|---|---|---|---|---|---|---|
| Standard | 1.347 | 1.373 | 1.397 | 1.423 | 1.447 | 1.473 | 1.497 |
| Camarilla | 1.406 | 1.411 | 1.415 | 1.420 | 1.425 | 1.429 | 1.434 |
| Woodie | 1.345 | 1.373 | 1.395 | 1.423 | 1.445 | 1.473 | 1.495 |
| Fibonacci | 1.373 | 1.392 | 1.404 | 1.423 | 1.442 | 1.454 | 1.473 |
| Pivot points | S3 | S2 | S1 | PP | R1 | R2 | R3 |
|---|---|---|---|---|---|---|---|
| Standard | 0.927 | 1.058 | 1.227 | 1.358 | 1.527 | 1.658 | 1.827 |
| Camarilla | 1.313 | 1.340 | 1.368 | 1.395 | 1.423 | 1.450 | 1.478 |
| Woodie | 0.945 | 1.068 | 1.245 | 1.368 | 1.545 | 1.668 | 1.845 |
| Fibonacci | 1.058 | 1.173 | 1.244 | 1.358 | 1.473 | 1.544 | 1.658 |
| Pivot points | S3 | S2 | S1 | PP | R1 | R2 | R3 |
|---|---|---|---|---|---|---|---|
| Standard | 0.647 | 0.883 | 1.077 | 1.313 | 1.507 | 1.743 | 1.937 |
| Camarilla | 1.152 | 1.191 | 1.231 | 1.270 | 1.309 | 1.349 | 1.388 |
| Woodie | 0.625 | 0.873 | 1.055 | 1.303 | 1.485 | 1.733 | 1.915 |
| Fibonacci | 0.883 | 1.048 | 1.149 | 1.313 | 1.478 | 1.579 | 1.743 |
Numerical data
The following is the status of the technical indicators and moving averages at the time of publication of this technical analysis:
| RSI (14): | 71.19 | |
| MACD (12,26,9): | 0.0370 | |
| Directional Movement: | 24.621 | |
| AROON (14): | 50.000 | |
| DEMA (21): | 1.384 | |
| Parabolic SAR (0,02-0,02-0,2): | 1.191 | |
| Elder Ray (13): | 0.190 | |
| Super Trend (3,10): | 1.249 | |
| Zig ZAG (10): | 1.695 | |
| VORTEX (21): | 0.9580 | |
| Stochastique (14,3,5): | 79.48 | |
| TEMA (21): | 1.463 | |
| Williams %R (14): | 0.00 | |
| Chande Momentum Oscillator (20): | 0.425 | |
| Repulse (5,40,3): | 18.0720 | |
| ROCnROLL: | 1 | |
| TRIX (15,9): | -0.0910 | |
| Courbe Coppock: | 28.81 |
| MA7: | 1.431 | |
| MA20: | 1.313 | |
| MA50: | 1.349 | |
| MA100: | 1.493 | |
| MAexp7: | 1.467 | |
| MAexp20: | 1.358 | |
| MAexp50: | 1.377 | |
| MAexp100: | 1.436 | |
| Price / MA7: | +24.74% | |
| Price / MA20: | +35.95% | |
| Price / MA50: | +32.32% | |
| Price / MA100: | +19.56% | |
| Price / MAexp7: | +21.68% | |
| Price / MAexp20: | +31.44% | |
| Price / MAexp50: | +29.63% | |
| Price / MAexp100: | +24.30% |
News
The latest news and videos published on SINGULUS TECHNOL. EO 1 at the time of the analysis were as follows:
- EQS-News: SINGULUS TECHNOLOGIES reports preliminary Key Financial Figures for the First Half of 2024
- EQS-Adhoc: SINGULUS TECHNOLOGIES AG: Reorganization of Financing completed - Publication of half-year report on August 28, 2024
- EQS-Adhoc: SINGULUS TECHNOLOGIES AG: Reorganization of financing - Publication of half-year report delayed
- EQS-News: SINGULUS TECHNOLOGIES - Successful Annual General Meeting on July 25, 2024
- EQS-Adhoc: SINGULUS TECHNOLOGIES AG: Report of the Executive Board to the Annual General Meeting - Reorganization of the Financing - Correction of the Forecast
About author
Online


Add a comment
Comments
0 comments on the analysis SINGULUS TECHNOL. EO 1 - Daily