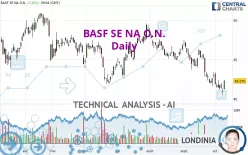
BASF SE NA O.N. - Daily - Technical analysis published on 10/10/2023 (GMT)
- 337
- 0
Click here for a new analysis!
- Timeframe : Daily
- - Analysis generated on
- Status : INVALID

Summary of the analysis

Additional analysis
Quotes
BASF SE NA O.N. rating 42.275 EUR. The price has increased by +3.26% since the last closing and was traded between 41.245 EUR and 42.410 EUR over the period. The price is currently at +2.50% from its lowest and -0.32% from its highest.A bullish opening was detected by the Central Gaps scanner. Buyers are trying to impose a bullish momentum in the very short term.
Bullish opening
Type : Bullish
Timeframe : Openning
A study of price movements over other periods shows the following variations:
Near a new LOW record (1 year)
Type : Bearish
Timeframe : Weekly
Near a new LOW record (1st january)
Type : Bearish
Timeframe : Weekly
Near a new LOW record (1 month)
Type : Bearish
Timeframe : Weekly
Technical
A technical analysis in Daily of this BASF SE NA O.N. chart shows a sharp bearish trend. The signals given by moving averages are 92.86% bearish. This strong bearish trend is confirmed by the strong signals currently being given by short-term moving averages. The Central Indicators market scanner currently does not detect any result that concerns moving averages.
In fact, Central Analyzer took into account 18 technical indicators and the result was as follows: 6 are bullish, 5 are neutral and 7 are bearish. Caution: the Central Indicators scanner currently detects an excess:
CCI indicator: bullish divergence
Type : Bullish
Timeframe : Daily
Pivot points : price is over resistance 3
Type : Neutral
Timeframe : Daily
Parabolic SAR indicator bullish reversal
Type : Bullish
Timeframe : Daily
Price is back over the pivot point
Type : Bullish
Timeframe : Weekly
An analysis of the price chart with the Central Patterns scanner (detector of chart patterns and resistances and supports) shows a result that can have an impact on the price change:
Horizontal resistance is broken
Type : Bullish
Timeframe : Daily
The Central Candlesticks scanner which studies Japanese candlesticks did not detect anything.
| S3 | S2 | S1 | Price | R1 | R2 | R3 | |
|---|---|---|---|---|---|---|---|
| ProTrendLines | 30.253 | 37.606 | 41.380 | 42.275 | 43.397 | 47.719 | 49.364 |
| Change (%) | -28.44% | -11.04% | -2.12% | - | +2.65% | +12.88% | +16.77% |
| Change | -12.022 | -4.669 | -0.895 | - | +1.122 | +5.444 | +7.089 |
| Level | Major | Major | Minor | - | Major | Minor | Major |
Pivot points can also be used to set your price objectives. Here is the price situation in relation to pivot points:
| Pivot points | S3 | S2 | S1 | PP | R1 | R2 | R3 |
|---|---|---|---|---|---|---|---|
| Standard | 39.653 | 40.067 | 40.503 | 40.917 | 41.353 | 41.767 | 42.203 |
| Camarilla | 40.706 | 40.784 | 40.862 | 40.940 | 41.018 | 41.096 | 41.174 |
| Woodie | 39.665 | 40.073 | 40.515 | 40.923 | 41.365 | 41.773 | 42.215 |
| Fibonacci | 40.067 | 40.391 | 40.592 | 40.917 | 41.241 | 41.442 | 41.767 |
| Pivot points | S3 | S2 | S1 | PP | R1 | R2 | R3 |
|---|---|---|---|---|---|---|---|
| Standard | 38.700 | 39.950 | 40.885 | 42.135 | 43.070 | 44.320 | 45.255 |
| Camarilla | 41.219 | 41.419 | 41.620 | 41.820 | 42.020 | 42.221 | 42.421 |
| Woodie | 38.543 | 39.871 | 40.728 | 42.056 | 42.913 | 44.241 | 45.098 |
| Fibonacci | 39.950 | 40.785 | 41.300 | 42.135 | 42.970 | 43.485 | 44.320 |
| Pivot points | S3 | S2 | S1 | PP | R1 | R2 | R3 |
|---|---|---|---|---|---|---|---|
| Standard | 34.658 | 38.117 | 40.533 | 43.992 | 46.408 | 49.867 | 52.283 |
| Camarilla | 41.334 | 41.873 | 42.412 | 42.950 | 43.489 | 44.027 | 44.566 |
| Woodie | 34.138 | 37.856 | 40.013 | 43.731 | 45.888 | 49.606 | 51.763 |
| Fibonacci | 38.117 | 40.361 | 41.747 | 43.992 | 46.236 | 47.622 | 49.867 |
Numerical data
The following is the status of the technical indicators and moving averages at the time of publication of this technical analysis:
| RSI (14): | 43.83 | |
| MACD (12,26,9): | -1.0140 | |
| Directional Movement: | -10.323 | |
| AROON (14): | -92.857 | |
| DEMA (21): | 41.597 | |
| Parabolic SAR (0,02-0,02-0,2): | 40.480 | |
| Elder Ray (13): | -0.534 | |
| Super Trend (3,10): | 43.736 | |
| Zig ZAG (10): | 42.375 | |
| VORTEX (21): | 0.7430 | |
| Stochastique (14,3,5): | 20.81 | |
| TEMA (21): | 41.168 | |
| Williams %R (14): | -60.02 | |
| Chande Momentum Oscillator (20): | -0.685 | |
| Repulse (5,40,3): | 3.5640 | |
| ROCnROLL: | -1 | |
| TRIX (15,9): | -0.3140 | |
| Courbe Coppock: | 13.08 |
| MA7: | 41.701 | |
| MA20: | 43.161 | |
| MA50: | 44.881 | |
| MA100: | 45.311 | |
| MAexp7: | 41.885 | |
| MAexp20: | 42.897 | |
| MAexp50: | 44.243 | |
| MAexp100: | 44.939 | |
| Price / MA7: | +1.38% | |
| Price / MA20: | -2.05% | |
| Price / MA50: | -5.81% | |
| Price / MA100: | -6.70% | |
| Price / MAexp7: | +0.93% | |
| Price / MAexp20: | -1.45% | |
| Price / MAexp50: | -4.45% | |
| Price / MAexp100: | -5.93% |
News
The last news published on BASF SE NA O.N. at the time of the generation of this analysis was as follows:
- BASF executive Kristen Pforr inducted into Women in Manufacturing Hall of Fame
- Cheniere and BASF Sign Long-Term LNG Sale and Purchase Agreement
- EQS-Adhoc: BASF SE: BASF Group achieves Q2 2023 EBIT before special items in line with analyst consensus and adjusts outlook for 2023
- Gotion High-tech Signed Strategic Agreements with Siemens and BASF Respectively
- Gotion High-tech Signed Strategic Agreements with Siemens and BASF Respectively
About author
Online


Add a comment
Comments
0 comments on the analysis BASF SE NA O.N. - Daily