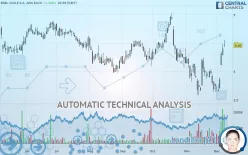
ENEL CHILE S.A. ADS EACH - Daily - Technical analysis published on 12/10/2019 (GMT)
- 166
- 0
- Who voted?
Click here for a new analysis!
- Timeframe : Daily
- - Analysis generated on
- Status : TARGET REACHED

Summary of the analysis

Additional analysis
Quotes
ENEL CHILE S.A. ADS EACH rating 4.46 USD. The price has increased by +1.36% since the last closing with the lowest point at 4.43 USD and the highest point at 4.56 USD. The deviation from the price is +0.68% for the low point and -2.19% for the high point.The Central Gaps scanner detects a bullish opening. A small advantage for buyers in the very short term.
Bullish opening
Type : Bullish
Timeframe : Openning
Here is a more detailed summary of the historical variations registered by ENEL CHILE S.A. ADS EACH:
Abnormal volumes
Timeframe : 5 days
Abnormal volumes
Timeframe : 20 days
Technical
Technical analysis of ENEL CHILE S.A. ADS EACH in Daily shows an overall slightly bullish trend. Only 60.71% of the signals given by moving averages are bullish. This slightly bullish trend is reinforced by the strong signals currently being given by short-term moving averages. The Central Indicators scanner does not detect any result on moving averages that would impact this trend.
In fact, 15 technical indicators on 18 studied are currently positioned bullish. Caution: the Central Indicators scanner currently detects an excess:
CCI indicator is overbought : over 100
Type : Neutral
Timeframe : Daily
Williams %R indicator is overbought : over -20
Type : Neutral
Timeframe : Daily
Price is back over the pivot point
Type : Bullish
Timeframe : Daily
Price is back over the pivot point
Type : Bullish
Timeframe : Weekly
The analysis of the price chart with Central Patterns scanners does not return any result.
The Central Candlesticks scanner which studies Japanese candlesticks did not detect anything.
| S3 | S2 | S1 | Price | R1 | R2 | R3 | |
|---|---|---|---|---|---|---|---|
| ProTrendLines | 3.98 | 4.21 | 4.39 | 4.46 | 4.53 | 4.96 | 5.13 |
| Change (%) | -10.76% | -5.61% | -1.57% | - | +1.57% | +11.21% | +15.02% |
| Change | -0.48 | -0.25 | -0.07 | - | +0.07 | +0.50 | +0.67 |
| Level | Major | Major | Major | - | Intermediate | Intermediate | Minor |
To determine price objectives, it is also possible to use the pivot points. Here is the price position in relation to pivot points:
| Pivot points | S3 | S2 | S1 | PP | R1 | R2 | R3 |
|---|---|---|---|---|---|---|---|
| Standard | 4.08 | 4.18 | 4.29 | 4.39 | 4.50 | 4.60 | 4.71 |
| Camarilla | 4.34 | 4.36 | 4.38 | 4.40 | 4.42 | 4.44 | 4.46 |
| Woodie | 4.09 | 4.18 | 4.30 | 4.39 | 4.51 | 4.60 | 4.72 |
| Fibonacci | 4.18 | 4.26 | 4.31 | 4.39 | 4.47 | 4.52 | 4.60 |
| Pivot points | S3 | S2 | S1 | PP | R1 | R2 | R3 |
|---|---|---|---|---|---|---|---|
| Standard | 3.03 | 3.34 | 3.87 | 4.18 | 4.71 | 5.02 | 5.55 |
| Camarilla | 4.17 | 4.25 | 4.32 | 4.40 | 4.48 | 4.55 | 4.63 |
| Woodie | 3.14 | 3.40 | 3.98 | 4.24 | 4.82 | 5.08 | 5.66 |
| Fibonacci | 3.34 | 3.66 | 3.86 | 4.18 | 4.50 | 4.70 | 5.02 |
| Pivot points | S3 | S2 | S1 | PP | R1 | R2 | R3 |
|---|---|---|---|---|---|---|---|
| Standard | 2.79 | 3.18 | 3.47 | 3.86 | 4.15 | 4.54 | 4.83 |
| Camarilla | 3.56 | 3.63 | 3.69 | 3.75 | 3.81 | 3.88 | 3.94 |
| Woodie | 2.73 | 3.16 | 3.41 | 3.84 | 4.09 | 4.52 | 4.77 |
| Fibonacci | 3.18 | 3.44 | 3.60 | 3.86 | 4.12 | 4.28 | 4.54 |
Numerical data
The following is the status of technical indicators and moving averages registered at the time this technical analysis was created:
| RSI (14): | 62.88 | |
| MACD (12,26,9): | 0.0100 | |
| Directional Movement: | 18.65 | |
| AROON (14): | 42.86 | |
| DEMA (21): | 4.00 | |
| Parabolic SAR (0,02-0,02-0,2): | 3.69 | |
| Elder Ray (13): | 0.45 | |
| Super Trend (3,10): | 3.89 | |
| Zig ZAG (10): | 4.46 | |
| VORTEX (21): | 1.0000 | |
| Stochastique (14,3,5): | 91.47 | |
| TEMA (21): | 4.10 | |
| Williams %R (14): | -10.84 | |
| Chande Momentum Oscillator (20): | 0.52 | |
| Repulse (5,40,3): | 3.6700 | |
| ROCnROLL: | 1 | |
| TRIX (15,9): | -0.3000 | |
| Courbe Coppock: | 7.14 |
| MA7: | 4.02 | |
| MA20: | 3.94 | |
| MA50: | 4.20 | |
| MA100: | 4.26 | |
| MAexp7: | 4.15 | |
| MAexp20: | 4.03 | |
| MAexp50: | 4.13 | |
| MAexp100: | 4.26 | |
| Price / MA7: | +10.95% | |
| Price / MA20: | +13.20% | |
| Price / MA50: | +6.19% | |
| Price / MA100: | +4.69% | |
| Price / MAexp7: | +7.47% | |
| Price / MAexp20: | +10.67% | |
| Price / MAexp50: | +7.99% | |
| Price / MAexp100: | +4.69% |
News
The last news published on ENEL CHILE S.A. ADS EACH at the time of the generation of this analysis was as follows:
About author

Online


Add a comment
Comments
0 comments on the analysis ENEL CHILE S.A. ADS EACH - Daily