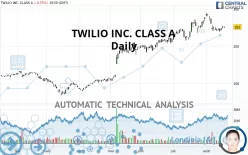
TWILIO INC. CLASS A - Daily - Technical analysis published on 08/20/2020 (GMT)
- 387
- 0
- Who voted?
Click here for a new analysis!
- Timeframe : Daily
- - Analysis generated on
- Status : TARGET REACHED

Summary of the analysis

Additional analysis
Quotes
The TWILIO INC. CLASS A rating is 251.00 USD. The price registered a decrease of -0.37% on the session and was traded between 248.50 USD and 253.40 USD over the period. The price is currently at +1.01% from its lowest and -0.95% from its highest.The Central Gaps scanner detects a bearish opening. A small advantage for sellers in the very short term.
Bearish opening
Type : Bearish
Timeframe : Openning
A study of price movements over other periods shows the following variations:
Technical
Technical analysis of TWILIO INC. CLASS A in Daily shows an overall bullish trend. 71.43% of the signals given by moving averages are bullish. Caution: the neutral signals currently given by short-term moving averages show us that the global trend is losing momentum. An assessment of moving averages reveals a bullish signal that could impact this trend:
Bullish price crossover with adaptative moving average 20
Type : Bullish
Timeframe : Daily
An assessment of technical indicators does not currently provide any relevant information on the direction of future price movements.
Caution: the Central Indicators scanner currently detects an excess:
Williams %R indicator is overbought : over -20
Type : Neutral
Timeframe : Daily
Pivot points : price is over resistance 1
Type : Neutral
Timeframe : Weekly
RSI indicator is back over 50
Type : Bullish
Timeframe : Daily
Price is back over the pivot point
Type : Bullish
Timeframe : Daily
Price is back under the pivot point
Type : Bearish
Timeframe : Weekly
The Central Patterns scanner, which studies chart patterns, resistances and supports, has identified these signals:
Near horizontal resistance
Type : Bearish
Timeframe : Daily
Near support of channel
Type : Bullish
Timeframe : Daily
The Central Candlesticks scanner which studies Japanese candlesticks did not detect anything.
| S3 | S2 | S1 | Price | R1 | R2 | |
|---|---|---|---|---|---|---|
| ProTrendLines | 149.95 | 189.02 | 208.62 | 251.00 | 262.97 | 286.33 |
| Change (%) | -40.26% | -24.69% | -16.88% | - | +4.77% | +14.08% |
| Change | -101.05 | -61.98 | -42.38 | - | +11.97 | +35.33 |
| Level | Major | Minor | Intermediate | - | Minor | Major |
To determine price objectives, it is also possible to use the pivot points. Here is the price position in relation to pivot points:
| Pivot points | S3 | S2 | S1 | PP | R1 | R2 | R3 |
|---|---|---|---|---|---|---|---|
| Standard | 240.63 | 244.03 | 247.99 | 251.39 | 255.35 | 258.75 | 262.71 |
| Camarilla | 249.92 | 250.59 | 251.27 | 251.94 | 252.62 | 253.29 | 253.96 |
| Woodie | 240.90 | 244.17 | 248.26 | 251.53 | 255.62 | 258.89 | 262.98 |
| Fibonacci | 244.03 | 246.85 | 248.58 | 251.39 | 254.21 | 255.94 | 258.75 |
| Pivot points | S3 | S2 | S1 | PP | R1 | R2 | R3 |
|---|---|---|---|---|---|---|---|
| Standard | 220.63 | 229.57 | 234.82 | 243.76 | 249.00 | 257.94 | 263.19 |
| Camarilla | 236.16 | 237.46 | 238.76 | 240.06 | 241.36 | 242.66 | 243.96 |
| Woodie | 218.78 | 228.65 | 232.97 | 242.83 | 247.15 | 257.02 | 261.34 |
| Fibonacci | 229.57 | 234.99 | 238.34 | 243.76 | 249.18 | 252.53 | 257.94 |
| Pivot points | S3 | S2 | S1 | PP | R1 | R2 | R3 |
|---|---|---|---|---|---|---|---|
| Standard | 172.25 | 193.29 | 235.35 | 256.39 | 298.45 | 319.49 | 361.55 |
| Camarilla | 260.07 | 265.85 | 271.64 | 277.42 | 283.20 | 288.99 | 294.77 |
| Woodie | 182.77 | 198.55 | 245.87 | 261.65 | 308.97 | 324.75 | 372.07 |
| Fibonacci | 193.29 | 217.39 | 232.28 | 256.39 | 280.49 | 295.38 | 319.49 |
Numerical data
The following is the status of technical indicators and moving averages registered at the time this technical analysis was created:
| RSI (14): | 51.64 | |
| MACD (12,26,9): | 2.3000 | |
| Directional Movement: | -0.44 | |
| AROON (14): | -64.28 | |
| DEMA (21): | 256.31 | |
| Parabolic SAR (0,02-0,02-0,2): | 270.12 | |
| Elder Ray (13): | -0.47 | |
| Super Trend (3,10): | 277.00 | |
| Zig ZAG (10): | 251.00 | |
| VORTEX (21): | 0.9600 | |
| Stochastique (14,3,5): | 23.33 | |
| TEMA (21): | 248.56 | |
| Williams %R (14): | -75.18 | |
| Chande Momentum Oscillator (20): | -35.33 | |
| Repulse (5,40,3): | 0.2500 | |
| ROCnROLL: | -1 | |
| TRIX (15,9): | 0.3400 | |
| Courbe Coppock: | 12.45 |
| MA7: | 245.74 | |
| MA20: | 257.14 | |
| MA50: | 237.31 | |
| MA100: | 190.22 | |
| MAexp7: | 249.50 | |
| MAexp20: | 251.01 | |
| MAexp50: | 234.29 | |
| MAexp100: | 203.73 | |
| Price / MA7: | +2.14% | |
| Price / MA20: | -2.39% | |
| Price / MA50: | +5.77% | |
| Price / MA100: | +31.95% | |
| Price / MAexp7: | +0.60% | |
| Price / MAexp20: | +0.00% | |
| Price / MAexp50: | +7.13% | |
| Price / MAexp100: | +23.20% |
News
The last news published on TWILIO INC. CLASS A at the time of the generation of this analysis was as follows:
- Be My Eyes Chooses Twilio to Bring Sight to People With Visual Impairments
- Twilio to Announce Fourth Quarter and Full Year 2019 Financial Results on February 5, 2020
- Twilio Named One of the 2019 Best Workplaces for Diversity by Great Place to Work® and FORTUNE
- CPaaS Growing by Over 40% per Year; Twilio Leads the Charge
- Twilio.org Announces Second Round of Grants Supporting Nonprofits Engaged in Crisis Communications
About author

Online


Add a comment
Comments
0 comments on the analysis TWILIO INC. CLASS A - Daily