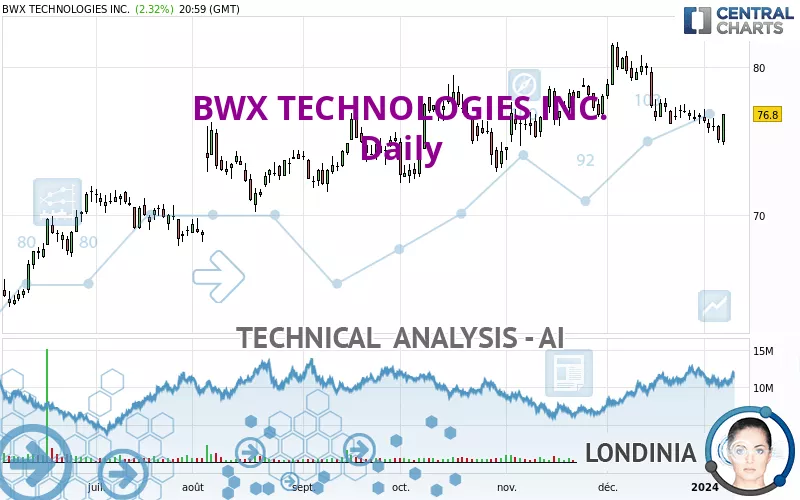
BWX TECHNOLOGIES INC. - Daily - Technical analysis published on 01/09/2024 (GMT)
- 141
- 0
Click here for a new analysis!
- Timeframe : Daily
- - Analysis generated on
- Status : TARGET REACHED
Summary of the analysis

Additional analysis
Quotes
The BWX TECHNOLOGIES INC. price is 76.80 USD. The price has increased by +2.32% since the last closing and was traded between 74.69 USD and 76.82 USD over the period. The price is currently at +2.83% from its lowest and -0.03% from its highest.The Central Gaps scanner detects a bearish opening. A small advantage for sellers in the very short term.
Bearish opening
Type : Bearish
Timeframe : Openning
So that you have an overall view of the price change, here is a table showing the variations over several periods:
Near a new HIGH record (1st january)
Type : Bullish
Timeframe : Weekly
New LOW record (1 month)
Type : Bearish
Timeframe : Weekly
Technical
Technical analysis of this Daily chart of BWX TECHNOLOGIES INC. indicates that the overall trend is bullish. 64.29% of the signals given by moving averages are bullish. Caution: the current slightly bearish signals from short-term moving averages indicate that the overall trend may be slowing down. The Central Indicators scanner detects bullish signals on moving averages that could impact this trend:
Bullish price crossover with Moving Average 100
Type : Bullish
Timeframe : Daily
Bullish price crossover with adaptative moving average 20
Type : Bullish
Timeframe : Daily
Bullish price crossover with adaptative moving average 50
Type : Bullish
Timeframe : Daily
Bullish price crossover with adaptative moving average 100
Type : Bullish
Timeframe : Daily
In fact, Central Analyzer took into account 18 technical indicators and the result was as follows: 7 are bullish, 5 are neutral and 6 are bearish. Caution: the Central Indicators scanner currently detects an excess:
CCI indicator: bullish divergence
Type : Bullish
Timeframe : Daily
Pivot points : price is over resistance 1
Type : Neutral
Timeframe : Weekly
Pivot points : price is over resistance 2
Type : Neutral
Timeframe : Daily
Ichimoku : price is over the cloud
Type : Bullish
Timeframe : Daily
Williams %R indicator is back over -50
Type : Bullish
Timeframe : Daily
The analysis of the price chart with Central Patterns scanners does not return any result.
The presence of a bullish Japanese candlestick pattern detected by Central Candlesticks that could cause a very short term rebound was also detected:
Bullish engulfing lines
Type : Bullish
Timeframe : Daily
| S3 | S2 | S1 | Price | R1 | R2 | |
|---|---|---|---|---|---|---|
| ProTrendLines | 67.95 | 72.79 | 76.19 | 76.80 | 78.06 | 81.45 |
| Change (%) | -11.52% | -5.22% | -0.79% | - | +1.64% | +6.05% |
| Change | -8.85 | -4.01 | -0.61 | - | +1.26 | +4.65 |
| Level | Minor | Intermediate | Major | - | Major | Major |
Attention could also be paid to pivot points to set price objectives:
| Pivot points | S3 | S2 | S1 | PP | R1 | R2 | R3 |
|---|---|---|---|---|---|---|---|
| Standard | 73.26 | 73.97 | 75.39 | 76.10 | 77.52 | 78.23 | 79.65 |
| Camarilla | 76.21 | 76.41 | 76.61 | 76.80 | 77.00 | 77.19 | 77.39 |
| Woodie | 73.61 | 74.15 | 75.74 | 76.28 | 77.87 | 78.41 | 80.00 |
| Fibonacci | 73.97 | 74.79 | 75.29 | 76.10 | 76.92 | 77.42 | 78.23 |
| Pivot points | S3 | S2 | S1 | PP | R1 | R2 | R3 |
|---|---|---|---|---|---|---|---|
| Standard | 69.17 | 72.66 | 74.69 | 78.18 | 80.21 | 83.70 | 85.73 |
| Camarilla | 75.21 | 75.72 | 76.22 | 76.73 | 77.24 | 77.74 | 78.25 |
| Woodie | 68.45 | 72.30 | 73.97 | 77.82 | 79.49 | 83.34 | 85.01 |
| Fibonacci | 72.66 | 74.77 | 76.07 | 78.18 | 80.29 | 81.59 | 83.70 |
Numerical data
The following are the details of the technical indicators and moving averages that were collected to generate this technical analysis:
| RSI (14): | 48.77 | |
| MACD (12,26,9): | -0.4800 | |
| Directional Movement: | -5.63 | |
| AROON (14): | -85.71 | |
| DEMA (21): | 76.38 | |
| Parabolic SAR (0,02-0,02-0,2): | 78.16 | |
| Elder Ray (13): | -0.83 | |
| Super Trend (3,10): | 78.64 | |
| Zig ZAG (10): | 76.80 | |
| VORTEX (21): | 0.7700 | |
| Stochastique (14,3,5): | 27.61 | |
| TEMA (21): | 75.70 | |
| Williams %R (14): | -33.44 | |
| Chande Momentum Oscillator (20): | -0.49 | |
| Repulse (5,40,3): | 1.8700 | |
| ROCnROLL: | 1 | |
| TRIX (15,9): | -0.0600 | |
| Courbe Coppock: | 5.27 |
| MA7: | 76.18 | |
| MA20: | 77.22 | |
| MA50: | 77.10 | |
| MA100: | 75.62 | |
| MAexp7: | 76.23 | |
| MAexp20: | 76.88 | |
| MAexp50: | 76.80 | |
| MAexp100: | 75.17 | |
| Price / MA7: | +0.81% | |
| Price / MA20: | -0.54% | |
| Price / MA50: | -0.39% | |
| Price / MA100: | +1.56% | |
| Price / MAexp7: | +0.75% | |
| Price / MAexp20: | -0.10% | |
| Price / MAexp50: | -0% | |
| Price / MAexp100: | +2.17% |
News
Don't forget to follow the news on BWX TECHNOLOGIES INC.. At the time of publication of this analysis, the latest news was as follows:
- BWX Technologies Reports Second Quarter 2023 Results
- BWXT Awarded an Engineering Contract from TerraPower for the Natrium™ Demonstration Project
- BWXT to Provide Nuclear Reactor Engine and Fuel for DARPA Space Project
- BWX Technologies to Announce Second Quarter 2023 Results on Thursday, August 3
- BWX Technologies Reports First Quarter 2023 Results
About author

Online


Add a comment
Comments
0 comments on the analysis BWX TECHNOLOGIES INC. - Daily