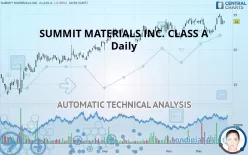
SUMMIT MATERIALS INC. CLASS A - Daily - Technical analysis published on 12/27/2019 (GMT)
- 260
- 0
- Who voted?
Click here for a new analysis!
- Timeframe : Daily
- - Analysis generated on
- Status : LEVEL MAINTAINED

Summary of the analysis
Additional analysis
Quotes
The SUMMIT MATERIALS INC. CLASS A price is 24.00 USD. The price registered a decrease of -0.50% on the session and was traded between 23.72 USD and 24.09 USD over the period. The price is currently at +1.18% from its lowest and -0.37% from its highest.The Central Gaps scanner detects a bearish opening. A small advantage for sellers in the very short term.
Bearish opening
Type : Bearish
Timeframe : Openning
So that you have an overall view of the price change, here is a table showing the variations over several periods:
Near a new HIGH record (1 year)
Type : Bullish
Timeframe : Weekly
Near a new HIGH record (1st january)
Type : Bullish
Timeframe : Weekly
Near a new HIGH record (1 month)
Type : Bullish
Timeframe : Weekly
Technical
A technical analysis in Daily of this SUMMIT MATERIALS INC. CLASS A chart shows a strongly bullish trend. 89.29% of the signals given by moving averages are bullish. The slightly bullish signals given by the short-term moving averages indicate this trend is showing signs of running out of steam. The Central Indicators scanner does not detect any result on moving averages that would impact this trend.
The technical indicators are bullish. There is still some doubt about the price increase.
Caution: the Central Indicators scanner currently detects an excess:
Williams %R indicator is overbought : over -20
Type : Neutral
Timeframe : Daily
Price is back over the pivot point
Type : Bullish
Timeframe : Daily
Price is back over the pivot point
Type : Bullish
Timeframe : Weekly
Central Patterns, the scanner specializing in chart patterns, did not identify any signals.
The Central Candlesticks scanner which studies Japanese candlesticks did not detect anything.
| S3 | S2 | S1 | Price | R1 | R2 | R3 | |
|---|---|---|---|---|---|---|---|
| ProTrendLines | 15.81 | 18.16 | 21.90 | 24.00 | 24.20 | 25.65 | 28.59 |
| Change (%) | -34.13% | -24.33% | -8.75% | - | +0.83% | +6.88% | +19.13% |
| Change | -8.19 | -5.84 | -2.10 | - | +0.20 | +1.65 | +4.59 |
| Level | Minor | Major | Major | - | Major | Minor | Intermediate |
To determine price objectives, it is also possible to use the pivot points. Here is the price position in relation to pivot points:
| Pivot points | S3 | S2 | S1 | PP | R1 | R2 | R3 |
|---|---|---|---|---|---|---|---|
| Standard | 23.01 | 23.32 | 23.72 | 24.03 | 24.43 | 24.74 | 25.14 |
| Camarilla | 23.93 | 23.99 | 24.06 | 24.12 | 24.19 | 24.25 | 24.32 |
| Woodie | 23.06 | 23.34 | 23.77 | 24.05 | 24.48 | 24.76 | 25.19 |
| Fibonacci | 23.32 | 23.59 | 23.76 | 24.03 | 24.30 | 24.47 | 24.74 |
| Pivot points | S3 | S2 | S1 | PP | R1 | R2 | R3 |
|---|---|---|---|---|---|---|---|
| Standard | 20.46 | 21.46 | 23.21 | 24.21 | 25.96 | 26.96 | 28.71 |
| Camarilla | 24.19 | 24.45 | 24.70 | 24.95 | 25.20 | 25.45 | 25.71 |
| Woodie | 20.83 | 21.65 | 23.58 | 24.40 | 26.33 | 27.15 | 29.08 |
| Fibonacci | 21.46 | 22.51 | 23.16 | 24.21 | 25.26 | 25.91 | 26.96 |
| Pivot points | S3 | S2 | S1 | PP | R1 | R2 | R3 |
|---|---|---|---|---|---|---|---|
| Standard | 19.00 | 20.22 | 22.06 | 23.28 | 25.12 | 26.34 | 28.18 |
| Camarilla | 23.06 | 23.34 | 23.62 | 23.90 | 24.18 | 24.46 | 24.74 |
| Woodie | 19.31 | 20.38 | 22.37 | 23.44 | 25.43 | 26.50 | 28.49 |
| Fibonacci | 20.22 | 21.39 | 22.11 | 23.28 | 24.45 | 25.17 | 26.34 |
Numerical data
The following is the status of technical indicators and moving averages registered at the time this technical analysis was created:
| RSI (14): | 54.44 | |
| MACD (12,26,9): | 0.2400 | |
| Directional Movement: | 2.16 | |
| AROON (14): | 42.86 | |
| DEMA (21): | 23.94 | |
| Parabolic SAR (0,02-0,02-0,2): | 22.71 | |
| Elder Ray (13): | 0.13 | |
| Super Trend (3,10): | 22.94 | |
| Zig ZAG (10): | 24.00 | |
| VORTEX (21): | 0.9500 | |
| Stochastique (14,3,5): | 59.33 | |
| TEMA (21): | 24.00 | |
| Williams %R (14): | -38.36 | |
| Chande Momentum Oscillator (20): | 1.11 | |
| Repulse (5,40,3): | 0.8200 | |
| ROCnROLL: | 1 | |
| TRIX (15,9): | 0.0900 | |
| Courbe Coppock: | 2.81 |
| MA7: | 24.18 | |
| MA20: | 23.59 | |
| MA50: | 23.27 | |
| MA100: | 22.22 | |
| MAexp7: | 23.97 | |
| MAexp20: | 23.65 | |
| MAexp50: | 23.15 | |
| MAexp100: | 22.07 | |
| Price / MA7: | -0.74% | |
| Price / MA20: | +1.74% | |
| Price / MA50: | +3.14% | |
| Price / MA100: | +8.01% | |
| Price / MAexp7: | +0.13% | |
| Price / MAexp20: | +1.48% | |
| Price / MAexp50: | +3.67% | |
| Price / MAexp100: | +8.74% |
News
The latest news and videos published on SUMMIT MATERIALS INC. CLASS A at the time of the analysis were as follows:
- Summit Materials Announces Organizational Change
- Report: Developing Opportunities within Pitney Bowes, Alteryx, Summit Materials, MasTec, Lantheus, and Hudson Pacific Properties — Future Expectations, Projections Moving into 2018
- FMI Represents Midwest Minerals in Sale to Summit Materials
- Summit Materials, Inc. Class A to Host Earnings Call
- Summit Materials, Inc. Class A to Host Earnings Call
About author

Online


Add a comment
Comments
0 comments on the analysis SUMMIT MATERIALS INC. CLASS A - Daily