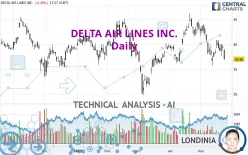
DELTA AIR LINES INC. - Daily - Technical analysis published on 05/24/2022 (GMT)
- 363
- 0
Click here for a new analysis!
- Timeframe : Daily
- - Analysis generated on
- Status : INVALID

Summary of the analysis

Additional analysis
Quotes
The DELTA AIR LINES INC. rating is 36.96 USD. The price is lower by -6.48% since the last closing and was traded between 36.89 USD and 38.95 USD over the period. The price is currently at +0.19% from its lowest and -5.11% from its highest.The Central Gaps scanner detects a bearish opening. A small advantage for sellers in the very short term.
Bearish opening
Type : Bearish
Timeframe : Openning
Here is a more detailed summary of the historical variations registered by DELTA AIR LINES INC.:
Near a new LOW record (1 month)
Type : Bearish
Timeframe : Weekly
Technical
Technical analysis of DELTA AIR LINES INC. in Daily shows an overall bearish trend. The signals given by moving averages are 71.43% bearish. This bearish trend is reinforced by the strong signals currently being given by short-term moving averages. The Central Indicators scanner detects a bearish signal on moving averages that could impact this trend:
Bearish price crossover with adaptative moving average 50
Type : Bearish
Timeframe : Daily
The probability of a further decline is moderate given the direction of the technical indicators.
Caution: the Central Indicators scanner currently detects an excess:
Williams %R indicator is oversold : under -80
Type : Neutral
Timeframe : Daily
Pivot points : price is under support 1
Type : Neutral
Timeframe : Weekly
Pivot points : price is under support 3
Type : Neutral
Timeframe : Daily
Ichimoku : price is under the cloud
Type : Bearish
Timeframe : Daily
Central Patterns, the scanner specializing in chart patterns, did not identify any signals.
The Central Candlesticks scanner which studies Japanese candlesticks did not detect anything.
| S3 | S2 | S1 | Price | R1 | R2 | R3 | |
|---|---|---|---|---|---|---|---|
| ProTrendLines | 32.07 | 33.53 | 36.69 | 36.96 | 37.87 | 39.36 | 41.51 |
| Change (%) | -13.23% | -9.28% | -0.73% | - | +2.46% | +6.49% | +12.31% |
| Change | -4.89 | -3.43 | -0.27 | - | +0.91 | +2.40 | +4.55 |
| Level | Minor | Intermediate | Major | - | Major | Intermediate | Intermediate |
Pivot points can also be used to set your price objectives. Here is the price situation in relation to pivot points:
| Pivot points | S3 | S2 | S1 | PP | R1 | R2 | R3 |
|---|---|---|---|---|---|---|---|
| Standard | 37.56 | 38.14 | 38.83 | 39.41 | 40.10 | 40.68 | 41.37 |
| Camarilla | 39.17 | 39.29 | 39.40 | 39.52 | 39.64 | 39.75 | 39.87 |
| Woodie | 37.62 | 38.17 | 38.89 | 39.44 | 40.16 | 40.71 | 41.43 |
| Fibonacci | 38.14 | 38.63 | 38.93 | 39.41 | 39.90 | 40.20 | 40.68 |
| Pivot points | S3 | S2 | S1 | PP | R1 | R2 | R3 |
|---|---|---|---|---|---|---|---|
| Standard | 34.04 | 35.83 | 37.24 | 39.03 | 40.44 | 42.23 | 43.64 |
| Camarilla | 37.76 | 38.05 | 38.35 | 38.64 | 38.93 | 39.23 | 39.52 |
| Woodie | 33.84 | 35.74 | 37.04 | 38.94 | 40.24 | 42.14 | 43.44 |
| Fibonacci | 35.83 | 37.06 | 37.81 | 39.03 | 40.26 | 41.01 | 42.23 |
| Pivot points | S3 | S2 | S1 | PP | R1 | R2 | R3 |
|---|---|---|---|---|---|---|---|
| Standard | 27.28 | 31.72 | 37.38 | 41.82 | 47.48 | 51.92 | 57.58 |
| Camarilla | 40.25 | 41.18 | 42.10 | 43.03 | 43.96 | 44.88 | 45.81 |
| Woodie | 27.88 | 32.03 | 37.98 | 42.13 | 48.08 | 52.23 | 58.18 |
| Fibonacci | 31.72 | 35.58 | 37.97 | 41.82 | 45.68 | 48.07 | 51.92 |
Numerical data
The following are the details of the technical indicators and moving averages that were collected to generate this technical analysis:
| RSI (14): | 40.42 | |
| MACD (12,26,9): | -0.6300 | |
| Directional Movement: | -11.84 | |
| AROON (14): | -42.86 | |
| DEMA (21): | 38.98 | |
| Parabolic SAR (0,02-0,02-0,2): | 36.10 | |
| Elder Ray (13): | -1.27 | |
| Super Trend (3,10): | 42.35 | |
| Zig ZAG (10): | 36.94 | |
| VORTEX (21): | 0.7700 | |
| Stochastique (14,3,5): | 32.35 | |
| TEMA (21): | 38.05 | |
| Williams %R (14): | -84.99 | |
| Chande Momentum Oscillator (20): | -4.10 | |
| Repulse (5,40,3): | -8.2000 | |
| ROCnROLL: | 2 | |
| TRIX (15,9): | -0.1100 | |
| Courbe Coppock: | 18.16 |
| MA7: | 38.93 | |
| MA20: | 40.29 | |
| MA50: | 39.71 | |
| MA100: | 39.51 | |
| MAexp7: | 38.64 | |
| MAexp20: | 39.58 | |
| MAexp50: | 39.74 | |
| MAexp100: | 39.69 | |
| Price / MA7: | -5.06% | |
| Price / MA20: | -8.27% | |
| Price / MA50: | -6.93% | |
| Price / MA100: | -6.45% | |
| Price / MAexp7: | -4.35% | |
| Price / MAexp20: | -6.62% | |
| Price / MAexp50: | -7.00% | |
| Price / MAexp100: | -6.88% |
News
Don't forget to follow the news on DELTA AIR LINES INC.. At the time of publication of this analysis, the latest news was as follows:
- Thinking about buying stock in Borqs Technologies, Nordic American Tanker, Delta Air Lines, Sono Group, or Toughbuilt Industries?
- Thinking about buying stock in Kaleido Biosciences, Royalty Pharma, PG&E Corp, Bitnile, or Delta Air Lines?
- Delta Air Lines Announces March Quarter 2022 Financial Results
-
 Delta Air Lines Stuck in Major Downtrend by FX empire
- Delta Air Lines Announces Webcast of March Quarter Financial Results
About author

Online


Add a comment
Comments
0 comments on the analysis DELTA AIR LINES INC. - Daily