| Open: | - |
| Change: | - |
| Volume: | - |
| Low: | - |
| High: | - |
| High / Low range: | - |
| Type: | Stocks |
| Ticker: | GRUB |
| ISIN: |
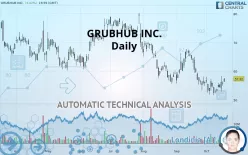
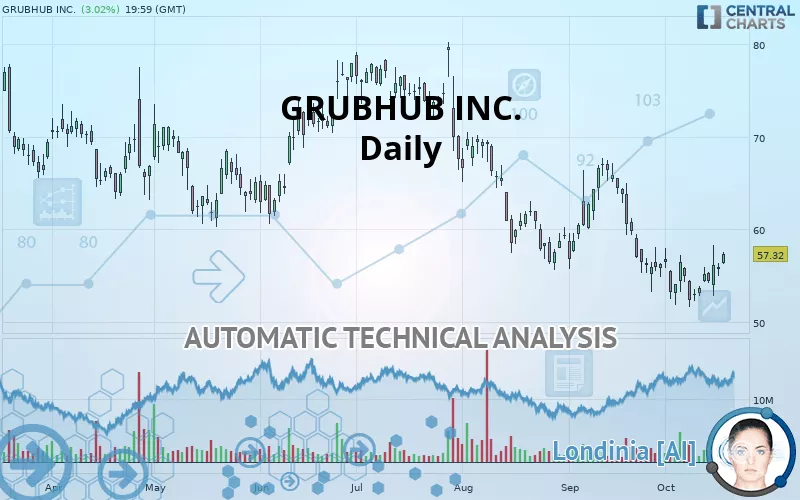
GRUBHUB INC. - Daily - Technical analysis published on 10/17/2019 (GMT)
- 320
- 0
- 10/17/2019 - 21:28
- Who voted?
Click here for a new analysis!
- Timeframe : Daily
- - Analysis generated on 10/17/2019 - 21:26
- Status : TARGET REACHED
Summary of the analysis
Additional analysis
Quotes
The GRUBHUB INC. rating is 57.32 USD. The price registered an increase of +3.02% on the session with the lowest point at 56.17 USD and the highest point at 57.54 USD. The deviation from the price is +2.05% for the low point and -0.38% for the high point.The Central Gaps scanner detects a bullish gap which is a sign that buyers have taken the lead in the very short term.
Opening Gap UP
Type : Bullish
Timeframe : Openning
A study of price movements over other periods shows the following variations:
Technical
A technical analysis in Daily of this GRUBHUB INC. chart shows a bearish trend. 75% of the signals given by moving averages are bearish. Caution: as the signals currently given by short-term moving averages are rather neutral, the bearish trend could slow down. An assessment of moving averages reveals a bearish signal that could impact this trend:
Bearish price crossover with Moving Average 20
Type : Bearish
Timeframe : Daily
In fact, according to the parameters integrated into the Central Analyzer system, 12 technical indicators out of 18 analysed are currently bullish. Caution: the Central Indicators scanner currently detects an excess:
Williams %R indicator is overbought : over -20
Type : Neutral
Timeframe : Daily
Pivot points : price is over resistance 1
Type : Neutral
Timeframe : Weekly
Pivot points : price is over resistance 2
Type : Neutral
Timeframe : Daily
Price is back under the pivot point
Type : Bearish
Timeframe : Daily
Momentum indicator is back under 0
Type : Bearish
Timeframe : Daily
Central Patterns, the market scanner focusing on chart patterns, resistances and supports found this result:
Near resistance of channel
Type : Bearish
Timeframe : Daily
For a small setback in the very short term, the Central Candlesticks scanner currently notes the presence of this bearish pattern in Japanese candlesticks:
Bearish harami
Type : Bearish
Timeframe : Daily
Bearish harami cross
Type : Bearish
Timeframe : Daily
| S3 | S2 | S1 | Price | R1 | R2 | R3 | |
|---|---|---|---|---|---|---|---|
| ProTrendLines | 32.89 | 43.22 | 52.30 | 57.32 | 61.68 | 71.51 | 79.88 |
| Change (%) | -42.62% | -24.60% | -8.76% | - | +7.61% | +24.76% | +39.36% |
| Change | -24.43 | -14.10 | -5.02 | - | +4.36 | +14.19 | +22.56 |
| Level | Minor | Major | Major | - | Major | Minor | Major |
To determine price objectives, it is also possible to use the pivot points. Here is the price position in relation to pivot points:
| Pivot points | S3 | S2 | S1 | PP | R1 | R2 | R3 |
|---|---|---|---|---|---|---|---|
| Standard | 53.56 | 54.27 | 54.95 | 55.66 | 56.34 | 57.05 | 57.73 |
| Camarilla | 55.26 | 55.39 | 55.51 | 55.64 | 55.77 | 55.90 | 56.02 |
| Woodie | 53.56 | 54.26 | 54.95 | 55.65 | 56.34 | 57.04 | 57.73 |
| Fibonacci | 54.27 | 54.80 | 55.13 | 55.66 | 56.19 | 56.52 | 57.05 |
| Pivot points | S3 | S2 | S1 | PP | R1 | R2 | R3 |
|---|---|---|---|---|---|---|---|
| Standard | 48.11 | 49.84 | 52.48 | 54.21 | 56.85 | 58.58 | 61.22 |
| Camarilla | 53.92 | 54.32 | 54.72 | 55.12 | 55.52 | 55.92 | 56.32 |
| Woodie | 48.57 | 50.07 | 52.94 | 54.44 | 57.31 | 58.81 | 61.68 |
| Fibonacci | 49.84 | 51.51 | 52.54 | 54.21 | 55.88 | 56.91 | 58.58 |
| Pivot points | S3 | S2 | S1 | PP | R1 | R2 | R3 |
|---|---|---|---|---|---|---|---|
| Standard | 35.97 | 44.60 | 50.41 | 59.04 | 64.85 | 73.48 | 79.29 |
| Camarilla | 52.24 | 53.56 | 54.89 | 56.21 | 57.53 | 58.86 | 60.18 |
| Woodie | 34.55 | 43.90 | 48.99 | 58.34 | 63.43 | 72.78 | 77.87 |
| Fibonacci | 44.60 | 50.12 | 53.53 | 59.04 | 64.56 | 67.97 | 73.48 |
Numerical data
The following is the status of technical indicators and moving averages registered at the time this technical analysis was created:
| RSI (14): | 50.54 | |
| MACD (12,26,9): | -1.4400 | |
| Directional Movement: | 6.13 | |
| AROON (14): | 35.71 | |
| DEMA (21): | 54.15 | |
| Parabolic SAR (0,02-0,02-0,2): | 52.26 | |
| Elder Ray (13): | 1.21 | |
| Super Trend (3,10): | 60.75 | |
| Zig ZAG (10): | 57.32 | |
| VORTEX (21): | 0.8200 | |
| Stochastique (14,3,5): | 71.03 | |
| TEMA (21): | 54.54 | |
| Williams %R (14): | -14.43 | |
| Chande Momentum Oscillator (20): | 0.87 | |
| Repulse (5,40,3): | 3.1000 | |
| ROCnROLL: | -1 | |
| TRIX (15,9): | -0.4800 | |
| Courbe Coppock: | 5.28 |
| MA7: | 55.00 | |
| MA20: | 55.50 | |
| MA50: | 59.36 | |
| MA100: | 65.57 | |
| MAexp7: | 55.59 | |
| MAexp20: | 56.32 | |
| MAexp50: | 59.72 | |
| MAexp100: | 63.81 | |
| Price / MA7: | +4.22% | |
| Price / MA20: | +3.28% | |
| Price / MA50: | -3.44% | |
| Price / MA100: | -12.58% | |
| Price / MAexp7: | +3.11% | |
| Price / MAexp20: | +1.78% | |
| Price / MAexp50: | -4.02% | |
| Price / MAexp100: | -10.17% |
News
The last news published on GRUBHUB INC. at the time of the generation of this analysis was as follows:
- 10/15/2019 - 20:05 Grubhub To Announce Third Quarter 2019 Financial Results On Oct. 29, 2019
- 10/10/2019 - 13:00 Just Salad Partners Exclusively with Grubhub to Launch Virtual Health Tribes™ Restaurant
- 10/01/2019 - 12:00 Turn Any Night Into Taco Night: Taco Bell® And Grubhub® Are Back With Free Delivery
- 09/26/2019 - 12:00 California Pizza Kitchen Kicks off National Pizza Month by Giving Away up to 10,000 Free Take and Bake Pizzas With Grubhub on October 1
- 09/04/2019 - 13:00 Grubhub Features Hundreds Of Millions Of Dollars In Free Food With The Launch Of "Perks"
About author

Online


Add a comment
Comments
0 comments on the analysis GRUBHUB INC. - Daily