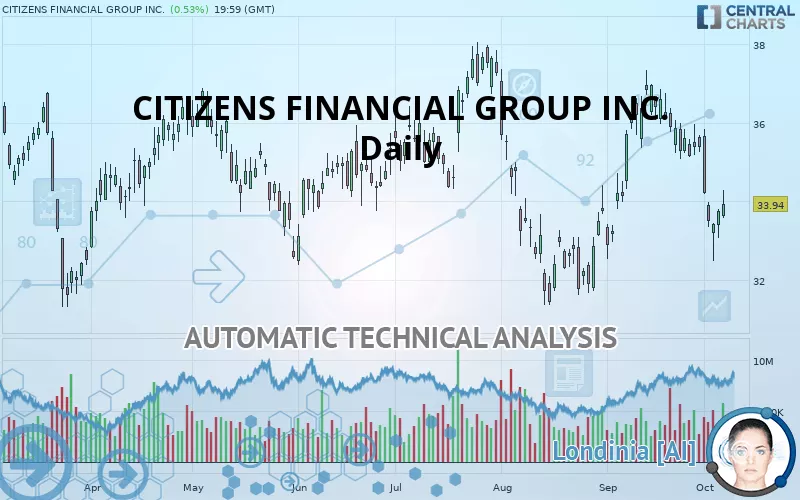
CITIZENS FINANCIAL GROUP INC. - Daily - Technical analysis published on 10/08/2019 (GMT)
- 330
- 0
- Who voted?
Click here for a new analysis!
- Timeframe : Daily
- - Analysis generated on
- Status : TARGET REACHED

Summary of the analysis

Additional analysis
Quotes
The CITIZENS FINANCIAL GROUP INC. price is 33.94 USD. The price has increased by +0.53% since the last closing and was traded between 33.56 USD and 34.28 USD over the period. The price is currently at +1.13% from its lowest and -0.99% from its highest.A bearish opening was detected by the Central Gaps scanner. Sellers are trying to impose a bearish trend in the very short term.
Bearish opening
Type : Bearish
Timeframe : Openning
So that you have an overall view of the price change, here is a table showing the variations over several periods:
Near a new LOW record (1 month)
Type : Bearish
Timeframe : Weekly
Technical
Technical analysis of CITIZENS FINANCIAL GROUP INC. in Daily shows an overall bearish trend. The signals given by moving averages are 64.29% bearish. This bearish trend is reinforced by the strong signals currently being given by short-term moving averages. There is no crossing of moving average by the price or crossing of moving averages between themselves.
An assessment of technical indicators shows a bearish signal.
Caution: the Central Indicators scanner currently detects an excess:
CCI indicator is oversold : under -100
Type : Neutral
Timeframe : Daily
Previous candle closed under Bollinger bands
Type : Neutral
Timeframe : Daily
Price is back over the pivot point
Type : Bullish
Timeframe : Daily
Price is back under the pivot point
Type : Bearish
Timeframe : Weekly
The Central Patterns scanner, which studies chart patterns, resistances and supports, has identified this signal:
Support of channel is broken
Type : Bearish
Timeframe : Daily
No result was found by the Central Candlesticks scanner on Japanese candlesticks.
| S3 | S2 | S1 | Price | R1 | R2 | R3 | |
|---|---|---|---|---|---|---|---|
| ProTrendLines | 27.95 | 31.48 | 32.58 | 33.94 | 33.99 | 35.28 | 36.03 |
| Change (%) | -17.65% | -7.25% | -4.01% | - | +0.15% | +3.95% | +6.16% |
| Change | -5.99 | -2.46 | -1.36 | - | +0.05 | +1.34 | +2.09 |
| Level | Major | Major | Major | - | Major | Intermediate | Intermediate |
To determine price objectives, it is also possible to use the pivot points. Here is the price position in relation to pivot points:
| Pivot points | S3 | S2 | S1 | PP | R1 | R2 | R3 |
|---|---|---|---|---|---|---|---|
| Standard | 32.56 | 32.81 | 33.29 | 33.54 | 34.02 | 34.27 | 34.75 |
| Camarilla | 33.56 | 33.63 | 33.69 | 33.76 | 33.83 | 33.89 | 33.96 |
| Woodie | 32.67 | 32.87 | 33.40 | 33.60 | 34.13 | 34.33 | 34.86 |
| Fibonacci | 32.81 | 33.09 | 33.26 | 33.54 | 33.82 | 33.99 | 34.27 |
| Pivot points | S3 | S2 | S1 | PP | R1 | R2 | R3 |
|---|---|---|---|---|---|---|---|
| Standard | 28.85 | 30.66 | 32.21 | 34.02 | 35.57 | 37.38 | 38.93 |
| Camarilla | 32.84 | 33.14 | 33.45 | 33.76 | 34.07 | 34.38 | 34.68 |
| Woodie | 28.72 | 30.60 | 32.08 | 33.96 | 35.44 | 37.32 | 38.80 |
| Fibonacci | 30.66 | 31.94 | 32.74 | 34.02 | 35.30 | 36.10 | 37.38 |
| Pivot points | S3 | S2 | S1 | PP | R1 | R2 | R3 |
|---|---|---|---|---|---|---|---|
| Standard | 28.01 | 30.27 | 32.82 | 35.08 | 37.63 | 39.89 | 42.44 |
| Camarilla | 34.05 | 34.49 | 34.93 | 35.37 | 35.81 | 36.25 | 36.69 |
| Woodie | 28.16 | 30.34 | 32.97 | 35.15 | 37.78 | 39.96 | 42.59 |
| Fibonacci | 30.27 | 32.11 | 33.24 | 35.08 | 36.92 | 38.05 | 39.89 |
Numerical data
The following are the details of the technical indicators and moving averages that were collected to generate this technical analysis:
| RSI (14): | 42.85 | |
| MACD (12,26,9): | -0.1900 | |
| Directional Movement: | -9.38 | |
| AROON (14): | -78.57 | |
| DEMA (21): | 34.63 | |
| Parabolic SAR (0,02-0,02-0,2): | 35.32 | |
| Elder Ray (13): | -0.66 | |
| Super Trend (3,10): | 35.63 | |
| Zig ZAG (10): | 33.94 | |
| VORTEX (21): | 0.9300 | |
| Stochastique (14,3,5): | 28.07 | |
| TEMA (21): | 34.26 | |
| Williams %R (14): | -66.44 | |
| Chande Momentum Oscillator (20): | -2.23 | |
| Repulse (5,40,3): | 1.2000 | |
| ROCnROLL: | 2 | |
| TRIX (15,9): | 0.0800 | |
| Courbe Coppock: | 11.45 |
| MA7: | 34.23 | |
| MA20: | 35.46 | |
| MA50: | 34.40 | |
| MA100: | 34.53 | |
| MAexp7: | 34.18 | |
| MAexp20: | 34.71 | |
| MAexp50: | 34.66 | |
| MAexp100: | 34.58 | |
| Price / MA7: | -0.85% | |
| Price / MA20: | -4.29% | |
| Price / MA50: | -1.34% | |
| Price / MA100: | -1.71% | |
| Price / MAexp7: | -0.70% | |
| Price / MAexp20: | -2.22% | |
| Price / MAexp50: | -2.08% | |
| Price / MAexp100: | -1.85% |
News
The latest news and videos published on CITIZENS FINANCIAL GROUP INC. at the time of the analysis were as follows:
- Citizens Financial Group Announces Prime Rate Change
- Citizens Financial Services, Inc. and MidCoast Community Bancorp, Inc. Sign Definitive Merger Agreement
- Citizens Financial Group Announces 2020 Earnings Conference Calls
- New ‘Made Ready’ Brand Platform Highlights Citizens Bank Commitment to Enabling Every Unique Journey
- Citizens Further Expands Corporate Banking Capabilities by Adding West Region, New Midwest Leadership
About author

Online


Add a comment
Comments
0 comments on the analysis CITIZENS FINANCIAL GROUP INC. - Daily