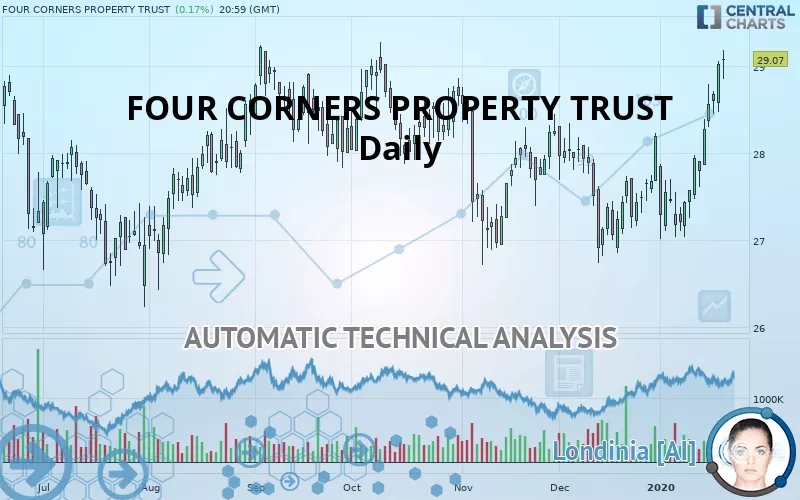
FOUR CORNERS PROPERTY TRUST - Daily - Technical analysis published on 01/23/2020 (GMT)
- 369
- 0
- Who voted?
Click here for a new analysis!
- Timeframe : Daily
- - Analysis generated on
- Status : TARGET REACHED

Summary of the analysis

Additional analysis
Quotes
FOUR CORNERS PROPERTY TRUST rating 29.07 USD. On the day, this instrument gained +0.17% with the lowest point at 28.85 USD and the highest point at 29.18 USD. The deviation from the price is +0.76% for the low point and -0.38% for the high point.The Central Gaps scanner detects a bullish gap which is a sign that buyers have taken the lead in the very short term.
Opening Gap UP
Type : Bullish
Timeframe : Openning
Here is a more detailed summary of the historical variations registered by FOUR CORNERS PROPERTY TRUST:
New HIGH record (1 year)
Type : Bullish
Timeframe : Weekly
New HIGH record (1st january)
Type : Bullish
Timeframe : Weekly
New HIGH record (1 month)
Type : Bullish
Timeframe : Weekly
Technical
Technical analysis of this Daily chart of FOUR CORNERS PROPERTY TRUST indicates that the overall trend is strongly bullish. 85.71% of the signals given by moving averages are bullish. This strongly bullish trend is supported by the strong bullish signals given by short-term moving averages. The Central Indicators market scanner currently does not detect any result that concerns moving averages.
Technical indicators are strongly bullish, suggesting that the price increase should continue.
Caution: the Central Indicators scanner currently detects an excess:
RSI indicator is overbought : over 70
Type : Neutral
Timeframe : Daily
CCI indicator is overbought : over 100
Type : Neutral
Timeframe : Daily
Williams %R indicator is overbought : over -20
Type : Neutral
Timeframe : Daily
Price is back over the pivot point
Type : Bullish
Timeframe : Daily
Price is back over the pivot point
Type : Bullish
Timeframe : Weekly
An analysis of the price chart with the Central Patterns scanner (detector of chart patterns and resistances and supports) shows a result that can have an impact on the price change:
Resistance of channel is broken
Type : Bullish
Timeframe : Daily
The presence of a bullish Japanese candlestick pattern detected by Central Candlesticks that could cause a very short term rebound was also detected:
Bullish engulfing lines
Type : Bullish
Timeframe : Daily
| S3 | S2 | S1 | Price | R1 | |
|---|---|---|---|---|---|
| ProTrendLines | 27.69 | 28.19 | 28.76 | 29.07 | 29.21 |
| Change (%) | -4.75% | -3.03% | -1.07% | - | +0.48% |
| Change | -1.38 | -0.88 | -0.31 | - | +0.14 |
| Level | Intermediate | Major | Intermediate | - | Major |
Pivot points can also be used to set your price objectives. Here is the price situation in relation to pivot points:
| Pivot points | S3 | S2 | S1 | PP | R1 | R2 | R3 |
|---|---|---|---|---|---|---|---|
| Standard | 28.06 | 28.27 | 28.64 | 28.85 | 29.22 | 29.43 | 29.80 |
| Camarilla | 28.86 | 28.91 | 28.97 | 29.02 | 29.07 | 29.13 | 29.18 |
| Woodie | 28.15 | 28.31 | 28.73 | 28.89 | 29.31 | 29.47 | 29.89 |
| Fibonacci | 28.27 | 28.49 | 28.63 | 28.85 | 29.07 | 29.21 | 29.43 |
| Pivot points | S3 | S2 | S1 | PP | R1 | R2 | R3 |
|---|---|---|---|---|---|---|---|
| Standard | 26.45 | 26.96 | 27.77 | 28.28 | 29.10 | 29.61 | 30.42 |
| Camarilla | 28.23 | 28.35 | 28.47 | 28.59 | 28.71 | 28.83 | 28.95 |
| Woodie | 26.60 | 27.03 | 27.93 | 28.36 | 29.25 | 29.68 | 30.58 |
| Fibonacci | 26.96 | 27.46 | 27.78 | 28.28 | 28.79 | 29.10 | 29.61 |
| Pivot points | S3 | S2 | S1 | PP | R1 | R2 | R3 |
|---|---|---|---|---|---|---|---|
| Standard | 25.29 | 25.87 | 26.87 | 27.45 | 28.46 | 29.03 | 30.04 |
| Camarilla | 27.45 | 27.59 | 27.74 | 27.88 | 28.03 | 28.17 | 28.32 |
| Woodie | 25.51 | 25.98 | 27.09 | 27.56 | 28.67 | 29.14 | 30.25 |
| Fibonacci | 25.87 | 26.47 | 26.85 | 27.45 | 28.06 | 28.43 | 29.03 |
Numerical data
The following is the status of the technical indicators and moving averages at the time of publication of this technical analysis:
| RSI (14): | 70.86 | |
| MACD (12,26,9): | 0.3700 | |
| Directional Movement: | 21.14 | |
| AROON (14): | 92.86 | |
| DEMA (21): | 28.35 | |
| Parabolic SAR (0,02-0,02-0,2): | 27.35 | |
| Elder Ray (13): | 0.84 | |
| Super Trend (3,10): | 27.73 | |
| Zig ZAG (10): | 29.07 | |
| VORTEX (21): | 1.2200 | |
| Stochastique (14,3,5): | 94.08 | |
| TEMA (21): | 28.71 | |
| Williams %R (14): | -5.06 | |
| Chande Momentum Oscillator (20): | 1.52 | |
| Repulse (5,40,3): | 2.4400 | |
| ROCnROLL: | 1 | |
| TRIX (15,9): | 0.0900 | |
| Courbe Coppock: | 7.93 |
| MA7: | 28.46 | |
| MA20: | 27.74 | |
| MA50: | 27.51 | |
| MA100: | 27.76 | |
| MAexp7: | 28.53 | |
| MAexp20: | 27.96 | |
| MAexp50: | 27.69 | |
| MAexp100: | 27.61 | |
| Price / MA7: | +2.14% | |
| Price / MA20: | +4.79% | |
| Price / MA50: | +5.67% | |
| Price / MA100: | +4.72% | |
| Price / MAexp7: | +1.89% | |
| Price / MAexp20: | +3.97% | |
| Price / MAexp50: | +4.98% | |
| Price / MAexp100: | +5.29% |
News
Don"t forget to follow the news on FOUR CORNERS PROPERTY TRUST. At the time of publication of this analysis, the latest news was as follows:
- FCPT Announces Acquisition of Texas Roadhouse and Chili’s Restaurant Properties for $2.1 Million
- FCPT Announces Acquisition of an Arby’s Restaurant Property for $1.6 Million
- FCPT Announces Acquisition of Five Properties From Washington Prime Group for $8.6 Million
- FCPT Announces Acquisition of Three Properties from PREIT for $5.3 million
- FCPT Announces Acquisition of Seven Chili’s Restaurant Properties for $28.7 Million
About author

Online


Add a comment
Comments
0 comments on the analysis FOUR CORNERS PROPERTY TRUST - Daily