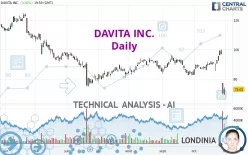
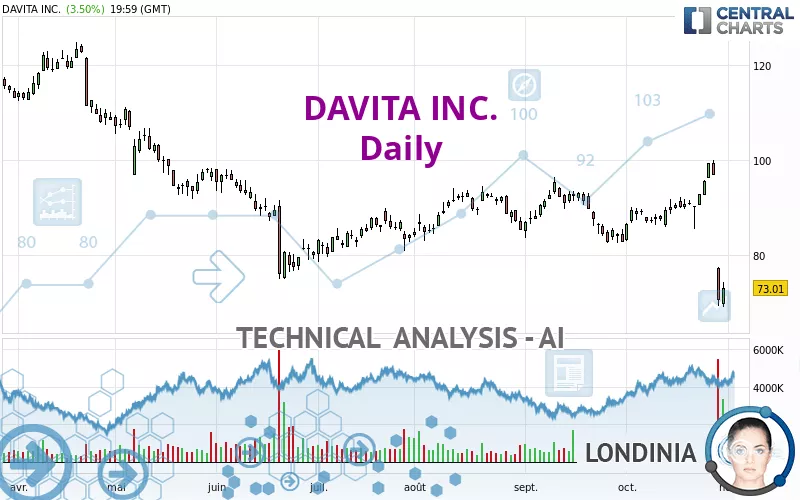
DAVITA INC. - Daily - Technical analysis published on 10/31/2022 (GMT)
- 195
- 0
Click here for a new analysis!
- Timeframe : Daily
- - Analysis generated on
- Status : TARGET REACHED
Summary of the analysis

Additional analysis
Quotes
DAVITA INC. rating 73.01 USD. The price registered an increase of +3.50% on the session with the lowest point at 69.00 USD and the highest point at 74.29 USD. The deviation from the price is +5.81% for the low point and -1.72% for the high point.So that you have an overall view of the price change, here is a table showing the variations over several periods:
New LOW record (1 year)
Type : Bearish
Timeframe : Weekly
New LOW record (1st january)
Type : Bearish
Timeframe : Weekly
New LOW record (1 month)
Type : Bearish
Timeframe : Weekly
The Central Volumes scanner detects abnormal volumes on the asset:
Abnormal volumes
Timeframe : 5 days
Technical
Technical analysis of this Daily chart of DAVITA INC. indicates that the overall trend is strongly bearish. The signals given by moving averages are 85.71% bearish. This strong bearish trend is confirmed by the strong signals currently being given by short-term moving averages. The Central Indicators market scanner is currently detecting several bearish signals that could impact this trend:
Bearish trend reversal : Moving Average 20
Type : Bearish
Timeframe : Daily
Bearish trend reversal : Moving Average 50
Type : Bearish
Timeframe : Daily
Bearish trend reversal : Moving Average 100
Type : Bearish
Timeframe : Daily
Bearish trend reversal : adaptative moving average 20
Type : Bearish
Timeframe : Daily
Bearish trend reversal : adaptative moving average 50
Type : Bearish
Timeframe : Daily
Bearish trend reversal : adaptative moving average 100
Type : Bearish
Timeframe : Daily
Moving Average bearish crossovers : MA20 & MA50
Type : Bearish
Timeframe : Daily
An assessment of technical indicators does not currently provide any relevant information on the direction of future price movements.
Caution: the Central Indicators scanner currently detects an excess:
CCI indicator is oversold : under -100
Type : Neutral
Timeframe : Daily
Previous candle closed under Bollinger bands
Type : Neutral
Timeframe : Daily
Williams %R indicator is oversold : under -80
Type : Neutral
Timeframe : Daily
MACD indicator is back under 0
Type : Bearish
Timeframe : Daily
Price is back over the pivot point
Type : Bullish
Timeframe : Daily
Central Patterns, the market scanner focusing on chart patterns, resistances and supports found this result:
Support of channel is broken
Type : Bearish
Timeframe : Daily
No result was found by the Central Candlesticks scanner on Japanese candlesticks.
| S3 | S2 | S1 | Price | R1 | R2 | R3 | |
|---|---|---|---|---|---|---|---|
| ProTrendLines | 21.20 | 43.42 | 65.39 | 73.01 | 75.95 | 84.23 | 89.41 |
| Change (%) | -70.96% | -40.53% | -10.44% | - | +4.03% | +15.37% | +22.46% |
| Change | -51.81 | -29.59 | -7.62 | - | +2.94 | +11.22 | +16.40 |
| Level | Intermediate | Major | Intermediate | - | Major | Major | Intermediate |
To determine price objectives, it is also possible to use the pivot points. Here is the price position in relation to pivot points:
| Pivot points | S3 | S2 | S1 | PP | R1 | R2 | R3 |
|---|---|---|---|---|---|---|---|
| Standard | 64.62 | 66.81 | 69.91 | 72.10 | 75.20 | 77.39 | 80.49 |
| Camarilla | 71.56 | 72.04 | 72.53 | 73.01 | 73.50 | 73.98 | 74.47 |
| Woodie | 65.08 | 67.04 | 70.37 | 72.33 | 75.66 | 77.62 | 80.95 |
| Fibonacci | 66.81 | 68.83 | 70.08 | 72.10 | 74.12 | 75.37 | 77.39 |
| Pivot points | S3 | S2 | S1 | PP | R1 | R2 | R3 |
|---|---|---|---|---|---|---|---|
| Standard | 29.26 | 49.26 | 59.90 | 79.90 | 90.54 | 110.54 | 121.18 |
| Camarilla | 62.11 | 64.92 | 67.73 | 70.54 | 73.35 | 76.16 | 78.97 |
| Woodie | 24.58 | 46.92 | 55.22 | 77.56 | 85.86 | 108.20 | 116.50 |
| Fibonacci | 49.26 | 60.96 | 68.20 | 79.90 | 91.60 | 98.84 | 110.54 |
| Pivot points | S3 | S2 | S1 | PP | R1 | R2 | R3 |
|---|---|---|---|---|---|---|---|
| Standard | 64.29 | 73.42 | 78.10 | 87.23 | 91.91 | 101.04 | 105.72 |
| Camarilla | 78.97 | 80.24 | 81.50 | 82.77 | 84.04 | 85.30 | 86.57 |
| Woodie | 62.06 | 72.31 | 75.87 | 86.12 | 89.68 | 99.93 | 103.49 |
| Fibonacci | 73.42 | 78.70 | 81.96 | 87.23 | 92.51 | 95.77 | 101.04 |
Numerical data
The following are the details of the technical indicators and moving averages that were collected to generate this technical analysis:
| RSI (14): | 32.07 | |
| MACD (12,26,9): | -1.2700 | |
| Directional Movement: | -30.86 | |
| AROON (14): | -14.29 | |
| DEMA (21): | 86.75 | |
| Parabolic SAR (0,02-0,02-0,2): | 99.90 | |
| Elder Ray (13): | -15.40 | |
| Super Trend (3,10): | 87.67 | |
| Zig ZAG (10): | 73.01 | |
| VORTEX (21): | 1.0400 | |
| Stochastique (14,3,5): | 31.82 | |
| TEMA (21): | 85.41 | |
| Williams %R (14): | -87.02 | |
| Chande Momentum Oscillator (20): | -16.49 | |
| Repulse (5,40,3): | -1.3600 | |
| ROCnROLL: | 2 | |
| TRIX (15,9): | 0.0600 | |
| Courbe Coppock: | 2.52 |
| MA7: | 88.25 | |
| MA20: | 88.78 | |
| MA50: | 88.97 | |
| MA100: | 87.43 | |
| MAexp7: | 84.60 | |
| MAexp20: | 87.83 | |
| MAexp50: | 88.62 | |
| MAexp100: | 90.58 | |
| Price / MA7: | -17.27% | |
| Price / MA20: | -17.76% | |
| Price / MA50: | -17.94% | |
| Price / MA100: | -16.49% | |
| Price / MAexp7: | -13.70% | |
| Price / MAexp20: | -16.87% | |
| Price / MAexp50: | -17.61% | |
| Price / MAexp100: | -19.40% |
News
Don't forget to follow the news on DAVITA INC.. At the time of publication of this analysis, the latest news was as follows:
- DaVita Inc. 3rd Quarter 2022 Results
- DaVita Inc. Schedules 3rd Quarter 2022 Investor Conference Call
- The DaVita Giving Foundation Provides $1.4 Million Grant Toward Addressing Food Insecurity
- DaVita Announces Adam H. Schechter to Join its Board of Directors
- Federman & Sherwood Investigates DaVita, Inc. for Data Breach
About author

Online


Add a comment
Comments
0 comments on the analysis DAVITA INC. - Daily