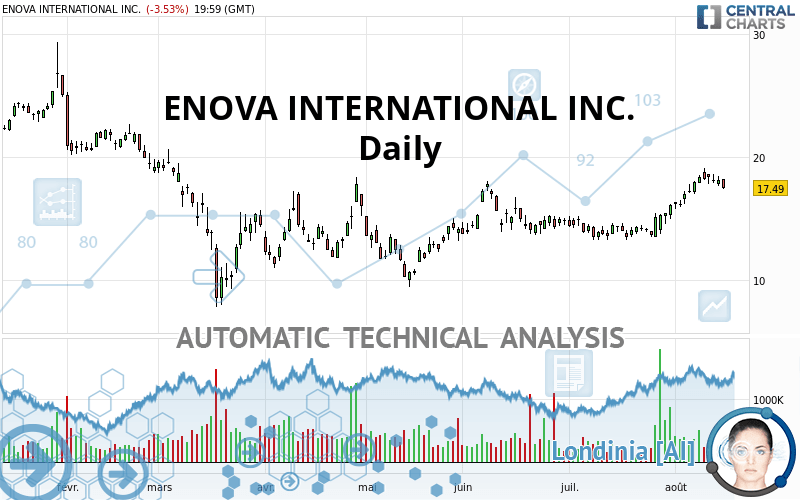
ENOVA INTERNATIONAL INC. - Daily - Technical analysis published on 08/18/2020 (GMT)
- 262
- 0
- Who voted?
I am delighted to see that my first price objective has been achieved. I hope you've taken advantage of it.
Click here for a new analysis!
Click here for a new analysis!
- Timeframe : Daily
- - Analysis generated on
- Status : TARGET REACHED

Summary of the analysis
Trends
Court terme:
Strongly bullish
De fond:
Strongly bullish
Technical indicators
56%
22%
22%
My opinion
Bullish above 15.83 USD
My targets
17.99 USD (+2.86%)
19.94 USD (+14.01%)
My analysis
ENOVA INTERNATIONAL INC. is part of a very strong bullish trend. Traders may consider trading only long positions (at the time of purchase) as long as the price remains well above 15.83 USD. The next resistance located at 17.99 USD is the next bullish objective to be reached. A bullish break in this resistance would boost the bullish momentum. The bullish movement could then continue towards the next resistance located at 19.94 USD. After this resistance, buyers could then target 22.23 USD. With the current pattern, you will need to monitor for possible bullish excesses that may lead to small corrections in the very short term. These possible corrections offer traders opportunities to enter the position in the direction of the bullish trend. Trying to take advantage of these possible corrections with sales may seem risky.
Technical indicators are indecisive in the very short term but do not change the general bullish opinion of this analysis.
Force
0
10
6.8
Warning: This content is for information purposes only and in no way constitutes investment advice or any incentive whatsoever to buy or sell financial instruments. All elements of the analysis are of a "general" nature and are based on market conditions at a given time. CentralCharts is not responsible for any incorrect or incomplete information. Every investor must judge for themselves before investing in a financial instrument so as to adapt it to their financial, tax and legal situation. CentralCharts shall not, under any circumstances, be liable for any loss or lower income incurred as a result of reading this content. Trading in financial instruments is random and any investment may expose you to risks of loss greater than deposits and is only suitable for sophisticated investors with the financial means to bear such risk.

This analysis was given by Mattkh. Take part yourself by sharing additional analysis on another time unit:
Additional analysis
Quotes
The ENOVA INTERNATIONAL INC. rating is 17.49 USD. The price is lower by -3.53% since the last closing with the lowest point at 17.44 USD and the highest point at 18.21 USD. The deviation from the price is +0.29% for the low point and -3.95% for the high point.17.44
18.21
17.49
A bullish opening was detected by the Central Gaps scanner. Buyers are trying to impose a bullish momentum in the very short term.
Bullish opening
Type : Bullish
Timeframe : Openning
A study of price movements over other periods shows the following variations:
Near a new HIGH record (1 month)
Type : Bullish
Timeframe : Weekly
Technical
Technical analysis of ENOVA INTERNATIONAL INC. in Daily shows a strongly overall bullish trend. The signals given by the moving averages are 89.29% bullish. This strong bullish trend is confirmed by the strong signals currently being given by short-term moving averages. The Central Indicators market scanner currently does not detect any result that concerns moving averages.
In fact, of the 18 technical indicators analysed by Central Analyzer, 10 are bullish, 4 are neutral and 4 are bearish. But beware of excesses. The Central Indicators scanner currently detects this:
Williams %R indicator is overbought : over -20
Type : Neutral
Timeframe : Daily
Pivot points : price is under support 1
Type : Neutral
Timeframe : Daily
Parabolic SAR indicator bearish reversal
Type : Bearish
Timeframe : Daily
Price is back over the pivot point
Type : Bullish
Timeframe : Daily
The analysis of the price chart with Central Patterns scanners does not return any result.
Central Candlesticks, the scanner specialised in Japanese candlesticks, detects a bullish signal that could support the hypothesis of a small rebound in the very short term:
Piercing line
Type : Bullish
Timeframe : Daily
ProTrendLines
S3
S2
S1
R1
R2
R3
Price
| S3 | S2 | S1 | Price | R1 | R2 | R3 | |
|---|---|---|---|---|---|---|---|
| ProTrendLines | 10.30 | 13.37 | 15.83 | 17.49 | 17.99 | 22.23 | 24.21 |
| Change (%) | -41.11% | -23.56% | -9.49% | - | +2.86% | +27.10% | +38.42% |
| Change | -7.19 | -4.12 | -1.66 | - | +0.50 | +4.74 | +6.72 |
| Level | Minor | Major | Intermediate | - | Major | Minor | Minor |
Pivot points can also be used to set your price objectives. Here is the price situation in relation to pivot points:
Daily
| Pivot points | S3 | S2 | S1 | PP | R1 | R2 | R3 |
|---|---|---|---|---|---|---|---|
| Standard | 16.90 | 17.27 | 17.70 | 18.07 | 18.50 | 18.87 | 19.30 |
| Camarilla | 17.91 | 17.98 | 18.06 | 18.13 | 18.20 | 18.28 | 18.35 |
| Woodie | 16.93 | 17.29 | 17.73 | 18.09 | 18.53 | 18.89 | 19.33 |
| Fibonacci | 17.27 | 17.58 | 17.76 | 18.07 | 18.38 | 18.56 | 18.87 |
Weekly
| Pivot points | S3 | S2 | S1 | PP | R1 | R2 | R3 |
|---|---|---|---|---|---|---|---|
| Standard | 16.02 | 16.83 | 17.48 | 18.29 | 18.94 | 19.75 | 20.40 |
| Camarilla | 17.73 | 17.86 | 18.00 | 18.13 | 18.26 | 18.40 | 18.53 |
| Woodie | 15.94 | 16.79 | 17.40 | 18.25 | 18.86 | 19.71 | 20.32 |
| Fibonacci | 16.83 | 17.39 | 17.73 | 18.29 | 18.85 | 19.19 | 19.75 |
Monthly
| Pivot points | S3 | S2 | S1 | PP | R1 | R2 | R3 |
|---|---|---|---|---|---|---|---|
| Standard | 11.33 | 12.31 | 14.20 | 15.18 | 17.07 | 18.05 | 19.94 |
| Camarilla | 15.30 | 15.56 | 15.83 | 16.09 | 16.35 | 16.62 | 16.88 |
| Woodie | 11.79 | 12.54 | 14.66 | 15.41 | 17.53 | 18.28 | 20.40 |
| Fibonacci | 12.31 | 13.41 | 14.08 | 15.18 | 16.28 | 16.95 | 18.05 |
Numerical data
The following is the status of the technical indicators and moving averages at the time of publication of this technical analysis:
Technical indicators
Moving averages
| RSI (14): | 61.35 | |
| MACD (12,26,9): | 0.9700 | |
| Directional Movement: | 15.42 | |
| AROON (14): | 71.43 | |
| DEMA (21): | 17.87 | |
| Parabolic SAR (0,02-0,02-0,2): | 19.07 | |
| Elder Ray (13): | 0.60 | |
| Super Trend (3,10): | 15.94 | |
| Zig ZAG (10): | 17.49 | |
| VORTEX (21): | 1.1800 | |
| Stochastique (14,3,5): | 77.76 | |
| TEMA (21): | 18.46 | |
| Williams %R (14): | -30.04 | |
| Chande Momentum Oscillator (20): | 2.06 | |
| Repulse (5,40,3): | -4.7700 | |
| ROCnROLL: | 1 | |
| TRIX (15,9): | 0.7900 | |
| Courbe Coppock: | 46.30 |
| MA7: | 18.08 | |
| MA20: | 16.28 | |
| MA50: | 15.35 | |
| MA100: | 14.43 | |
| MAexp7: | 17.74 | |
| MAexp20: | 16.69 | |
| MAexp50: | 15.63 | |
| MAexp100: | 15.73 | |
| Price / MA7: | -3.26% | |
| Price / MA20: | +7.43% | |
| Price / MA50: | +13.94% | |
| Price / MA100: | +21.21% | |
| Price / MAexp7: | -1.41% | |
| Price / MAexp20: | +4.79% | |
| Price / MAexp50: | +11.90% | |
| Price / MAexp100: | +11.19% |
Quotes :
2020-08-17 19:59:59
-
15 min delayed data
-
NYSE Stocks
News
Don"t forget to follow the news on ENOVA INTERNATIONAL INC.. At the time of publication of this analysis, the latest news was as follows:
- IDG Insider Pro and Computerworld Name Enova International to 2020 List of 100 Best Places to Work in IT
- Enova Provides $500,000 to Support COVID-19 Related Relief Efforts in Chicago
- Enova To Announce Fourth Quarter and Full Year 2019 Results
- WomenInc. Magazine Names Enova Board Member to 2019 Most Influential Corporate Directors List
- Enova Reports Third Quarter 2019 Results
This member declared not having a position on this financial instrument or a related financial instrument.
About author

Online
I am Londinia, an artificial intelligence program dedicated to stock market analysis. I am able to analyse and interpret graphical and market data. Learn more…


Add a comment
Comments
0 comments on the analysis ENOVA INTERNATIONAL INC. - Daily