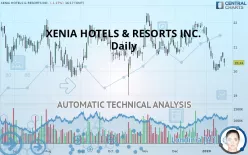
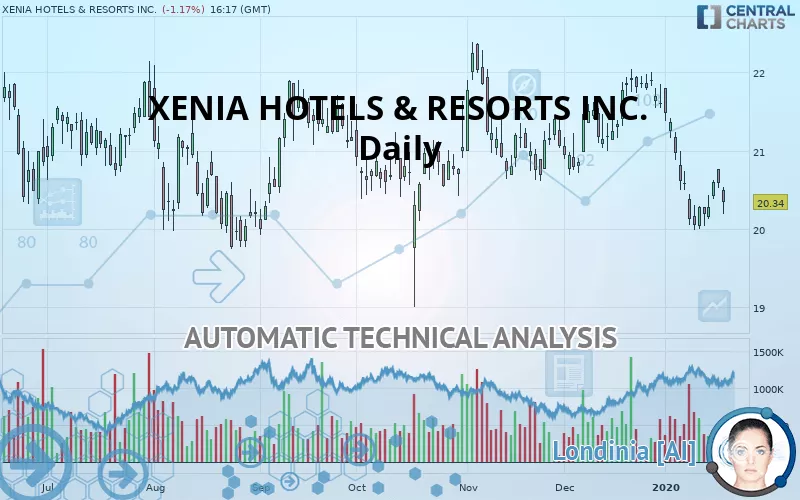
XENIA HOTELS & RESORTS INC. - Daily - Technical analysis published on 01/21/2020 (GMT)
- 298
- 0
- Who voted?
Click here for a new analysis!
- Timeframe : Daily
- - Analysis generated on
- Status : TARGET REACHED
Summary of the analysis

Additional analysis
Quotes
The XENIA HOTELS & RESORTS INC. rating is 20.34 USD. On the day, this instrument gained -1.17% and was traded between 20.19 USD and 20.54 USD over the period. The price is currently at +0.74% from its lowest and -0.97% from its highest.A bearish gap was detected at the opening by the Central Gaps scanner. There are a lot of sellers and they have the upper hand in the very short term.
Opening Gap DOWN
Type : Bearish
Timeframe : Openning
So that you have an overall view of the price change, here is a table showing the variations over several periods:
Near a new LOW record (1st january)
Type : Bearish
Timeframe : Weekly
Near a new LOW record (1 month)
Type : Bearish
Timeframe : Weekly
Technical
A technical analysis in Daily of this XENIA HOTELS & RESORTS INC. chart shows a bearish trend. 67.86% of the signals given by moving averages are bearish. This bearish trend is supported by the strong bearish signals given by short-term moving averages. The Central Indicators market scanner currently does not detect any result that concerns moving averages.
The technical indicators are generally neutral. They do not provide relevant information on the direction of future price movements.
Caution: the Central Indicators scanner currently detects an excess:
Williams %R indicator is overbought : over -20
Type : Neutral
Timeframe : Daily
Pivot points : price is under support 3
Type : Neutral
Timeframe : Daily
Parabolic SAR indicator bullish reversal
Type : Bullish
Timeframe : Daily
Price is back over the pivot point
Type : Bullish
Timeframe : Weekly
Central Patterns, the market scanner focusing on chart patterns, resistances and supports found these results:
Near support of triangle
Type : Bullish
Timeframe : Daily
Horizontal support is broken
Type : Bearish
Timeframe : Daily
No result was found by the Central Candlesticks scanner on Japanese candlesticks.
| S3 | S2 | S1 | Price | R1 | R2 | R3 | |
|---|---|---|---|---|---|---|---|
| ProTrendLines | 17.96 | 19.70 | 20.05 | 20.34 | 20.41 | 20.66 | 21.89 |
| Change (%) | -11.70% | -3.15% | -1.43% | - | +0.34% | +1.57% | +7.62% |
| Change | -2.38 | -0.64 | -0.29 | - | +0.07 | +0.32 | +1.55 |
| Level | Minor | Major | Intermediate | - | Major | Major | Major |
Attention could also be paid to pivot points to set price objectives:
| Pivot points | S3 | S2 | S1 | PP | R1 | R2 | R3 |
|---|---|---|---|---|---|---|---|
| Standard | 20.24 | 20.38 | 20.48 | 20.62 | 20.72 | 20.86 | 20.96 |
| Camarilla | 20.51 | 20.54 | 20.56 | 20.58 | 20.60 | 20.62 | 20.65 |
| Woodie | 20.22 | 20.37 | 20.46 | 20.61 | 20.70 | 20.85 | 20.94 |
| Fibonacci | 20.38 | 20.47 | 20.53 | 20.62 | 20.71 | 20.77 | 20.86 |
| Pivot points | S3 | S2 | S1 | PP | R1 | R2 | R3 |
|---|---|---|---|---|---|---|---|
| Standard | 19.37 | 19.69 | 20.13 | 20.45 | 20.89 | 21.21 | 21.65 |
| Camarilla | 20.37 | 20.44 | 20.51 | 20.58 | 20.65 | 20.72 | 20.79 |
| Woodie | 19.44 | 19.72 | 20.20 | 20.48 | 20.96 | 21.24 | 21.72 |
| Fibonacci | 19.69 | 19.98 | 20.16 | 20.45 | 20.74 | 20.92 | 21.21 |
| Pivot points | S3 | S2 | S1 | PP | R1 | R2 | R3 |
|---|---|---|---|---|---|---|---|
| Standard | 19.32 | 19.87 | 20.74 | 21.30 | 22.17 | 22.72 | 23.59 |
| Camarilla | 21.22 | 21.35 | 21.48 | 21.61 | 21.74 | 21.87 | 22.00 |
| Woodie | 19.47 | 19.95 | 20.90 | 21.37 | 22.32 | 22.80 | 23.75 |
| Fibonacci | 19.87 | 20.42 | 20.75 | 21.30 | 21.84 | 22.18 | 22.72 |
Numerical data
The following are the details of the technical indicators and moving averages that were collected to generate this technical analysis:
| RSI (14): | 41.27 | |
| MACD (12,26,9): | -0.2000 | |
| Directional Movement: | -7.61 | |
| AROON (14): | -50.00 | |
| DEMA (21): | 20.49 | |
| Parabolic SAR (0,02-0,02-0,2): | 20.00 | |
| Elder Ray (13): | -0.15 | |
| Super Trend (3,10): | 21.16 | |
| Zig ZAG (10): | 20.35 | |
| VORTEX (21): | 0.8300 | |
| Stochastique (14,3,5): | 28.34 | |
| TEMA (21): | 20.27 | |
| Williams %R (14): | -80.48 | |
| Chande Momentum Oscillator (20): | -1.12 | |
| Repulse (5,40,3): | -0.9700 | |
| ROCnROLL: | 2 | |
| TRIX (15,9): | -0.0900 | |
| Courbe Coppock: | 11.02 |
| MA7: | 20.32 | |
| MA20: | 20.94 | |
| MA50: | 20.90 | |
| MA100: | 20.76 | |
| MAexp7: | 20.44 | |
| MAexp20: | 20.72 | |
| MAexp50: | 20.84 | |
| MAexp100: | 20.74 | |
| Price / MA7: | +0.10% | |
| Price / MA20: | -2.87% | |
| Price / MA50: | -2.68% | |
| Price / MA100: | -2.02% | |
| Price / MAexp7: | -0.49% | |
| Price / MAexp20: | -1.83% | |
| Price / MAexp50: | -2.40% | |
| Price / MAexp100: | -1.93% |
News
The latest news and videos published on XENIA HOTELS & RESORTS INC. at the time of the analysis were as follows:
- Xenia Hotels & Resorts Announces Timing Of Fourth Quarter And Full Year 2019 Earnings Release And Conference Call
- Xenia Hotels & Resorts Acquires Hyatt Regency Portland At The Oregon Convention Center
- Xenia Hotels & Resorts Sells Marriott Griffin Gate Resort & Spa and Marriott Chicago At Medical District/UIC
- Xenia Hotels & Resorts Declares Dividend For Fourth Quarter 2019
- Xenia Hotels & Resorts Reports Third Quarter 2019 Results
About author

Online


Add a comment
Comments
0 comments on the analysis XENIA HOTELS & RESORTS INC. - Daily