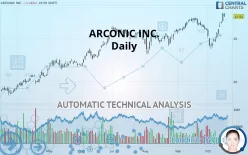
ARCONIC CORP. - Daily - Technical analysis published on 10/16/2019 (GMT)
- 248
- 0
- Who voted?
Click here for a new analysis!
- Timeframe : Daily
- - Analysis generated on
- Status : INVALID

Summary of the analysis
Additional analysis
Quotes
The ARCONIC INC. price is 27.51 USD. On the day, this instrument lost -1.26% and was between 27.47 USD and 27.92 USD. This implies that the price is at +0.15% from its lowest and at -1.47% from its highest.A bearish opening was detected by the Central Gaps scanner. Sellers are trying to impose a bearish trend in the very short term.
Bearish opening
Type : Bearish
Timeframe : Openning
Here is a more detailed summary of the historical variations registered by ARCONIC INC.:
New HIGH record (1 year)
Type : Bullish
Timeframe : Weekly
New HIGH record (1st january)
Type : Bullish
Timeframe : Weekly
New HIGH record (1 month)
Type : Bullish
Timeframe : Weekly
Technical
A technical analysis in Daily of this ARCONIC INC. chart shows a strongly bullish trend. 92.86% of the signals given by moving averages are bullish. This strongly bullish trend is supported by the strong bullish signals given by short-term moving averages. The Central Indicators market scanner is currently detecting a bullish signal that could impact this trend:
Bullish trend reversal : Moving Average 20
Type : Bullish
Timeframe : Daily
An assessment of technical indicators shows a strong bullish signal.
Caution: the Central Indicators scanner currently detects an excess:
RSI indicator is overbought : over 70
Type : Neutral
Timeframe : Daily
CCI indicator is overbought : over 100
Type : Neutral
Timeframe : Daily
Williams %R indicator is overbought : over -20
Type : Neutral
Timeframe : Daily
Pivot points : price is over resistance 1
Type : Neutral
Timeframe : Weekly
Aroon indicator bullish trend
Type : Bullish
Timeframe : Daily
MACD indicator is back over 0
Type : Bullish
Timeframe : Daily
Price is back over the pivot point
Type : Bullish
Timeframe : Daily
The Central Patterns scanner, which studies chart patterns, resistances and supports, has identified this signal:
Near resistance of channel
Type : Bearish
Timeframe : Daily
No result was found by the Central Candlesticks scanner on Japanese candlesticks.
| S3 | S2 | S1 | Price | R1 | R2 | R3 | |
|---|---|---|---|---|---|---|---|
| ProTrendLines | 24.24 | 26.15 | 27.31 | 27.51 | 28.16 | 30.84 | 40.18 |
| Change (%) | -11.89% | -4.94% | -0.73% | - | +2.36% | +12.10% | +46.06% |
| Change | -3.27 | -1.36 | -0.20 | - | +0.65 | +3.33 | +12.67 |
| Level | Major | Intermediate | Intermediate | - | Minor | Intermediate | Intermediate |
Attention could also be paid to pivot points to set price objectives:
| Pivot points | S3 | S2 | S1 | PP | R1 | R2 | R3 |
|---|---|---|---|---|---|---|---|
| Standard | 26.20 | 26.55 | 27.21 | 27.56 | 28.22 | 28.57 | 29.23 |
| Camarilla | 27.58 | 27.68 | 27.77 | 27.86 | 27.95 | 28.05 | 28.14 |
| Woodie | 26.35 | 26.63 | 27.36 | 27.64 | 28.37 | 28.65 | 29.38 |
| Fibonacci | 26.55 | 26.94 | 27.18 | 27.56 | 27.95 | 28.19 | 28.57 |
| Pivot points | S3 | S2 | S1 | PP | R1 | R2 | R3 |
|---|---|---|---|---|---|---|---|
| Standard | 22.81 | 23.68 | 25.06 | 25.93 | 27.31 | 28.18 | 29.56 |
| Camarilla | 25.83 | 26.04 | 26.24 | 26.45 | 26.66 | 26.86 | 27.07 |
| Woodie | 23.08 | 23.81 | 25.33 | 26.06 | 27.58 | 28.31 | 29.83 |
| Fibonacci | 23.68 | 24.54 | 25.07 | 25.93 | 26.79 | 27.32 | 28.18 |
| Pivot points | S3 | S2 | S1 | PP | R1 | R2 | R3 |
|---|---|---|---|---|---|---|---|
| Standard | 23.31 | 24.41 | 25.21 | 26.31 | 27.10 | 28.20 | 29.00 |
| Camarilla | 25.48 | 25.65 | 25.83 | 26.00 | 26.17 | 26.35 | 26.52 |
| Woodie | 23.16 | 24.33 | 25.05 | 26.23 | 26.95 | 28.12 | 28.84 |
| Fibonacci | 24.41 | 25.13 | 25.58 | 26.31 | 27.03 | 27.48 | 28.20 |
Numerical data
The following is the status of the technical indicators and moving averages at the time of publication of this technical analysis:
| RSI (14): | 65.21 | |
| MACD (12,26,9): | 0.2400 | |
| Directional Movement: | 18.75 | |
| AROON (14): | 64.29 | |
| DEMA (21): | 26.38 | |
| Parabolic SAR (0,02-0,02-0,2): | 24.90 | |
| Elder Ray (13): | 1.41 | |
| Super Trend (3,10): | 25.77 | |
| Zig ZAG (10): | 27.51 | |
| VORTEX (21): | 0.9700 | |
| Stochastique (14,3,5): | 94.71 | |
| TEMA (21): | 26.52 | |
| Williams %R (14): | -9.81 | |
| Chande Momentum Oscillator (20): | 1.51 | |
| Repulse (5,40,3): | 1.9000 | |
| ROCnROLL: | 1 | |
| TRIX (15,9): | -0.0200 | |
| Courbe Coppock: | 0.47 |
| MA7: | 26.45 | |
| MA20: | 26.01 | |
| MA50: | 25.85 | |
| MA100: | 25.12 | |
| MAexp7: | 26.69 | |
| MAexp20: | 26.16 | |
| MAexp50: | 25.79 | |
| MAexp100: | 24.88 | |
| Price / MA7: | +4.01% | |
| Price / MA20: | +5.77% | |
| Price / MA50: | +6.42% | |
| Price / MA100: | +9.51% | |
| Price / MAexp7: | +3.07% | |
| Price / MAexp20: | +5.16% | |
| Price / MAexp50: | +6.67% | |
| Price / MAexp100: | +10.57% |
News
The latest news and videos published on ARCONIC INC. at the time of the analysis were as follows:
- Arconic Board Approves Quarterly Dividend
- Arconic to Present at Morgan Stanley Laguna Conference
- Arconic Announces $200 Million Accelerated Share Repurchase
- USW, Arconic Announce Tentative Agreement
- Union Membership Authorizes Strike against Arconic
About author

Online


Add a comment
Comments
0 comments on the analysis ARCONIC CORP. - Daily