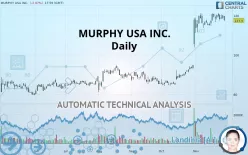
MURPHY USA INC. - Daily - Technical analysis published on 12/02/2019 (GMT)
- 285
- 0
- Who voted?
Click here for a new analysis!
- Timeframe : Daily
- - Analysis generated on
- Status : LEVEL MAINTAINED

Summary of the analysis

Additional analysis
Quotes
The MURPHY USA INC. price is 117.50 USD. The price is lower by -2.07% since the last closing with the lowest point at 117.43 USD and the highest point at 119.64 USD. The deviation from the price is +0.06% for the low point and -1.79% for the high point.The Central Gaps scanner detects a bearish opening marking the presence of sellers ahead of buyers at the opening but not sufficiently marked to allow the price to register a quotation gap.
Bearish opening
Type : Bearish
Timeframe : Openning
So that you have an overall view of the price change, here is a table showing the variations over several periods:
Near a new HIGH record (5 years)
Type : Bullish
Timeframe : Weekly
Near a new HIGH record (1 year)
Type : Bullish
Timeframe : Weekly
Near a new HIGH record (1st january)
Type : Bullish
Timeframe : Weekly
Near a new HIGH record (1 month)
Type : Bullish
Timeframe : Weekly
Technical
A technical analysis in Daily of this MURPHY USA INC. chart shows a strongly bullish trend. The signals given by moving averages are 82.14% bullish. This strongly bullish trend seems to be running out of steam given the signals being given by short-term moving averages. The Central Indicators scanner detects bearish signals on moving averages that could impact this trend:
Bearish price crossover with Moving Average 20
Type : Bearish
Timeframe : Daily
Bearish price crossover with adaptative moving average 20
Type : Bearish
Timeframe : Daily
In fact, of the 18 technical indicators analysed by Central Analyzer, 7 are bullish, 6 are neutral and 5 are bearish. Central Indicators, the detector scanner for these technical indicators has recently detected several signals:
Pivot points : price is under support 3
Type : Neutral
Timeframe : Daily
Price is back over the pivot point
Type : Bullish
Timeframe : Daily
Price is back over the pivot point
Type : Bullish
Timeframe : Weekly
Williams %R indicator is back under -50
Type : Bearish
Timeframe : Daily
No signals are given by Central Patterns, a market scanner specialised in chart patterns, resistances and supports.
The Central Candlesticks scanner, specialised in Japanese candlesticks, did not identify any signals.
| S3 | S2 | S1 | Price | R1 | |
|---|---|---|---|---|---|
| ProTrendLines | 86.47 | 93.34 | 115.11 | 117.50 | 120.84 |
| Change (%) | -26.41% | -20.56% | -2.03% | - | +2.84% |
| Change | -31.03 | -24.16 | -2.39 | - | +3.34 |
| Level | Major | Major | Intermediate | - | Major |
To determine price objectives, it is also possible to use the pivot points. Here is the price position in relation to pivot points:
| Pivot points | S3 | S2 | S1 | PP | R1 | R2 | R3 |
|---|---|---|---|---|---|---|---|
| Standard | 117.09 | 117.70 | 118.84 | 119.45 | 120.59 | 121.20 | 122.34 |
| Camarilla | 119.50 | 119.66 | 119.82 | 119.98 | 120.14 | 120.30 | 120.46 |
| Woodie | 117.36 | 117.83 | 119.11 | 119.58 | 120.86 | 121.33 | 122.61 |
| Fibonacci | 117.70 | 118.37 | 118.78 | 119.45 | 120.12 | 120.53 | 121.20 |
| Pivot points | S3 | S2 | S1 | PP | R1 | R2 | R3 |
|---|---|---|---|---|---|---|---|
| Standard | 112.90 | 114.83 | 117.38 | 119.31 | 121.86 | 123.79 | 126.34 |
| Camarilla | 118.70 | 119.11 | 119.52 | 119.93 | 120.34 | 120.75 | 121.16 |
| Woodie | 113.21 | 114.98 | 117.69 | 119.46 | 122.17 | 123.95 | 126.65 |
| Fibonacci | 114.83 | 116.54 | 117.60 | 119.31 | 121.02 | 122.08 | 123.79 |
| Pivot points | S3 | S2 | S1 | PP | R1 | R2 | R3 |
|---|---|---|---|---|---|---|---|
| Standard | 60.52 | 72.35 | 95.14 | 106.97 | 129.76 | 141.59 | 164.38 |
| Camarilla | 108.41 | 111.58 | 114.76 | 117.93 | 121.10 | 124.28 | 127.45 |
| Woodie | 66.00 | 75.09 | 100.62 | 109.71 | 135.24 | 144.33 | 169.86 |
| Fibonacci | 72.35 | 85.58 | 93.75 | 106.97 | 120.20 | 128.37 | 141.59 |
Numerical data
The following is the status of the technical indicators and moving averages at the time of publication of this technical analysis:
| RSI (14): | 62.23 | |
| MACD (12,26,9): | 5.2200 | |
| Directional Movement: | 15.91 | |
| AROON (14): | 71.43 | |
| DEMA (21): | 122.37 | |
| Parabolic SAR (0,02-0,02-0,2): | 116.08 | |
| Elder Ray (13): | 1.11 | |
| Super Trend (3,10): | 111.19 | |
| Zig ZAG (10): | 117.50 | |
| VORTEX (21): | 1.1700 | |
| Stochastique (14,3,5): | 64.73 | |
| TEMA (21): | 122.47 | |
| Williams %R (14): | -58.10 | |
| Chande Momentum Oscillator (20): | 0.93 | |
| Repulse (5,40,3): | -1.8700 | |
| ROCnROLL: | -1 | |
| TRIX (15,9): | 0.9100 | |
| Courbe Coppock: | 6.84 |
| MA7: | 119.05 | |
| MA20: | 117.72 | |
| MA50: | 100.58 | |
| MA100: | 94.51 | |
| MAexp7: | 118.66 | |
| MAexp20: | 114.85 | |
| MAexp50: | 105.35 | |
| MAexp100: | 97.88 | |
| Price / MA7: | -1.30% | |
| Price / MA20: | -0.19% | |
| Price / MA50: | +16.82% | |
| Price / MA100: | +24.33% | |
| Price / MAexp7: | -0.98% | |
| Price / MAexp20: | +2.31% | |
| Price / MAexp50: | +11.53% | |
| Price / MAexp100: | +20.04% |
News
The last news published on MURPHY USA INC. at the time of the generation of this analysis was as follows:
- Murphy USA, Inc. to Host Earnings Call
- Murphy USA, Inc. to Host Earnings Call
- Investor Network: Murphy USA, Inc. to Host Earnings Call
- Murphy USA Inc. Reports Second Quarter 2017 Results
- Murphy USA Schedules 2017 Second Quarter Results Conference Call
About author

Online


Add a comment
Comments
0 comments on the analysis MURPHY USA INC. - Daily