| Open: | 247.4 |
| Change: | -2.7 |
| Volume: | 765,412 |
| Low: | 243.0 |
| High: | 247.7 |
| High / Low range: | 4.7 |
| Type: | Stocks |
| Ticker: | DHR |
| ISIN: |
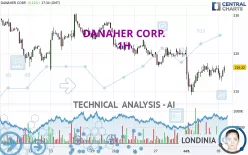
DANAHER CORP. - 1H - Technical analysis published on 10/05/2023 (GMT)
- 144
- 0
- 10/05/2023 - 17:50
Click here for a new analysis!
- Timeframe : 1H
- - Analysis generated on 10/05/2023 - 17:50
- Status : LEVEL MAINTAINED

Summary of the analysis

Additional analysis
Quotes
The DANAHER CORP. price is 215.91 USD. On the day, this instrument lost -0.07% and was traded between 212.63 USD and 216.87 USD over the period. The price is currently at +1.54% from its lowest and -0.44% from its highest.The Central Gaps scanner detects a bearish opening marking the presence of sellers ahead of buyers at the opening but not sufficiently marked to allow the price to register a quotation gap.
Bearish opening
Type : Bearish
Timeframe : Openning
Here is a more detailed summary of the historical variations registered by DANAHER CORP.:
Near a new LOW record (1 month)
Type : Bearish
Timeframe : Weekly
Technical
Technical analysis of this 1H chart of DANAHER CORP. indicates that the overall trend is bearish. 75.00% of the signals given by moving averages are bearish. Caution: the neutral signals currently given by short-term moving averages show us that the global trend is losing momentum. An assessment of moving averages reveals a bullish signal that could impact this trend:
Bullish trend reversal : adaptative moving average 20
Type : Bullish
Timeframe : 1 hour
Technical indicators are slightly bullish. There is therefore considerable uncertainty about the continuation of the increase.
Central Indicators, the detector scanner for these technical indicators recently detected a signal:
Pivot points : price is under support 1
Type : Neutral
Timeframe : Weekly
The Central Patterns scanner, which studies chart patterns, resistances and supports, has identified these signals:
Near horizontal resistance
Type : Bearish
Timeframe : 1 hour
Near resistance of channel
Type : Bearish
Timeframe : 1 hour
For a small setback in the very short term, the Central Candlesticks scanner currently notes the presence of this bearish pattern in Japanese candlesticks:
Bearish harami
Type : Bearish
Timeframe : 1 hour
| S3 | S2 | S1 | Price | R1 | R2 | R3 | |
|---|---|---|---|---|---|---|---|
| ProTrendLines | 199.23 | 209.12 | 215.63 | 215.91 | 220.23 | 226.09 | 230.56 |
| Change (%) | -7.73% | -3.14% | -0.13% | - | +2.00% | +4.71% | +6.79% |
| Change | -16.68 | -6.79 | -0.28 | - | +4.32 | +10.18 | +14.65 |
| Level | Intermediate | Major | Intermediate | - | Intermediate | Intermediate | Minor |
To determine price objectives, it is also possible to use the pivot points. Here is the price position in relation to pivot points:
| Pivot points | S3 | S2 | S1 | PP | R1 | R2 | R3 |
|---|---|---|---|---|---|---|---|
| Standard | 210.35 | 212.05 | 214.06 | 215.76 | 217.77 | 219.47 | 221.48 |
| Camarilla | 215.05 | 215.39 | 215.73 | 216.07 | 216.41 | 216.75 | 217.09 |
| Woodie | 210.51 | 212.13 | 214.22 | 215.84 | 217.93 | 219.55 | 221.64 |
| Fibonacci | 212.05 | 213.47 | 214.34 | 215.76 | 217.18 | 218.05 | 219.47 |
| Pivot points | S3 | S2 | S1 | PP | R1 | R2 | R3 |
|---|---|---|---|---|---|---|---|
| Standard | 209.17 | 212.78 | 216.36 | 219.97 | 223.55 | 227.16 | 230.74 |
| Camarilla | 217.97 | 218.63 | 219.29 | 219.95 | 220.61 | 221.27 | 221.93 |
| Woodie | 209.17 | 212.77 | 216.36 | 219.96 | 223.55 | 227.15 | 230.74 |
| Fibonacci | 212.78 | 215.52 | 217.22 | 219.97 | 222.71 | 224.41 | 227.16 |
| Pivot points | S3 | S2 | S1 | PP | R1 | R2 | R3 |
|---|---|---|---|---|---|---|---|
| Standard | 186.92 | 201.16 | 210.55 | 224.79 | 234.18 | 248.42 | 257.81 |
| Camarilla | 213.45 | 215.62 | 217.78 | 219.95 | 222.12 | 224.28 | 226.45 |
| Woodie | 184.51 | 199.95 | 208.14 | 223.58 | 231.77 | 247.21 | 255.40 |
| Fibonacci | 201.16 | 210.18 | 215.76 | 224.79 | 233.81 | 239.39 | 248.42 |
Numerical data
The following are the details of the technical indicators and moving averages that were collected to generate this technical analysis:
| RSI (14): | 48.54 | |
| MACD (12,26,9): | -0.4700 | |
| Directional Movement: | -2.90 | |
| AROON (14): | -64.28 | |
| DEMA (21): | 214.47 | |
| Parabolic SAR (0,02-0,02-0,2): | 212.34 | |
| Elder Ray (13): | 0.12 | |
| Super Trend (3,10): | 217.89 | |
| Zig ZAG (10): | 215.30 | |
| VORTEX (21): | 1.1400 | |
| Stochastique (14,3,5): | 46.43 | |
| TEMA (21): | 214.93 | |
| Williams %R (14): | -43.85 | |
| Chande Momentum Oscillator (20): | -0.33 | |
| Repulse (5,40,3): | 0.5200 | |
| ROCnROLL: | -1 | |
| TRIX (15,9): | -0.0400 | |
| Courbe Coppock: | 0.07 |
| MA7: | 217.04 | |
| MA20: | 220.85 | |
| MA50: | 224.96 | |
| MA100: | 217.48 | |
| MAexp7: | 214.98 | |
| MAexp20: | 215.21 | |
| MAexp50: | 216.80 | |
| MAexp100: | 219.09 | |
| Price / MA7: | -0.52% | |
| Price / MA20: | -2.24% | |
| Price / MA50: | -4.02% | |
| Price / MA100: | -0.72% | |
| Price / MAexp7: | +0.43% | |
| Price / MAexp20: | +0.33% | |
| Price / MAexp50: | -0.41% | |
| Price / MAexp100: | -1.45% |
News
The latest news and videos published on DANAHER CORP. at the time of the analysis were as follows:
- 09/08/2023 - 04:00 DEADLINE ACTION ALERT: The Schall Law Firm Encourages Investors in Danaher Corporation with Losses of $100,000 to Contact the Firm
- 09/04/2023 - 14:55 SHAREHOLDER ACTION NOTICE: The Schall Law Firm Encourages Investors in Danaher Corporation with Losses of $100,000 to Contact the Firm
- 08/08/2023 - 23:15 SHAREHOLDER ACTION ALERT: The Schall Law Firm Encourages Investors in Danaher Corporation with Losses of $100,000 to Contact the Firm
- 05/24/2023 - 22:30 SHAREHOLDER ACTION NOTICE: The Schall Law Firm Announces it is Investigating Claims Against Danaher Corporation and Encourages Investors with Losses to Contact the Firm
- 05/22/2023 - 23:50 INVESTOR ACTION NOTICE: The Schall Law Firm Announces it is Investigating Claims Against Danaher Corporation and Encourages Investors with Losses to Contact the Firm
About author
Online


Add a comment
Comments
0 comments on the analysis DANAHER CORP. - 1H