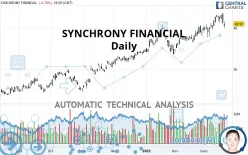
SYNCHRONY FINANCIAL - Daily - Technical analysis published on 03/21/2021 (GMT)
- 264
- 0
Click here for a new analysis!
- Timeframe : Daily
- - Analysis generated on
- Status : INVALID

Summary of the analysis

Additional analysis
Quotes
SYNCHRONY FINANCIAL rating 40.97 USD. On the day, this instrument lost -0.70% with the lowest point at 40.02 USD and the highest point at 41.52 USD. The deviation from the price is +2.37% for the low point and -1.32% for the high point.The Central Gaps scanner detects a bearish gap which is a sign that the sellers have taken the lead in the very short term.
Opening Gap DOWN
Type : Bearish
Timeframe : Openning
A study of price movements over other periods shows the following variations:
New HIGH record (5 years)
Type : Bullish
Timeframe : Weekly
Technical
Technical analysis of this Daily chart of SYNCHRONY FINANCIAL indicates that the overall trend is strongly bullish. 92.86% of the signals given by moving averages are bullish. The overall trend is supported by the strong bullish signals from short-term moving averages. The Central Indicators market scanner currently does not detect any result that concerns moving averages.
The probability of a further increase is slight given the direction of the technical indicators.
But beware of excesses. The Central Indicators scanner currently detects this:
CCI indicator: bearish divergence
Type : Bearish
Timeframe : Daily
MACD indicator: bearish divergence
Type : Bearish
Timeframe : Daily
RSI indicator: bearish divergence
Type : Bearish
Timeframe : Daily
Pivot points : price is over resistance 2
Type : Neutral
Timeframe : Daily
Pivot points : price is over resistance 2
Type : Neutral
Timeframe : Weekly
Pivot points : price is under support 3
Type : Neutral
Timeframe : Daily
The analysis of the price chart with Central Patterns scanners does not return any result.
The presence of a bearish pattern in Japanese candlesticks detected by Central Candlesticks that could cause a correction in the very short term was also detected:
Bearish engulfing lines
Type : Bearish
Timeframe : Daily
| S3 | S2 | S1 | Price | |
|---|---|---|---|---|
| ProTrendLines | 31.39 | 36.68 | 40.21 | 40.97 |
| Change (%) | -23.38% | -10.47% | -1.86% | - |
| Change | -9.58 | -4.29 | -0.76 | - |
| Level | Intermediate | Major | Major | - |
To determine price objectives, it is also possible to use the pivot points. Here is the price position in relation to pivot points:
| Pivot points | S3 | S2 | S1 | PP | R1 | R2 | R3 |
|---|---|---|---|---|---|---|---|
| Standard | 38.65 | 39.34 | 40.15 | 40.84 | 41.65 | 42.34 | 43.15 |
| Camarilla | 40.56 | 40.70 | 40.83 | 40.97 | 41.11 | 41.25 | 41.38 |
| Woodie | 38.72 | 39.37 | 40.22 | 40.87 | 41.72 | 42.37 | 43.22 |
| Fibonacci | 39.34 | 39.91 | 40.26 | 40.84 | 41.41 | 41.76 | 42.34 |
| Pivot points | S3 | S2 | S1 | PP | R1 | R2 | R3 |
|---|---|---|---|---|---|---|---|
| Standard | 35.87 | 37.94 | 39.46 | 41.53 | 43.05 | 45.12 | 46.64 |
| Camarilla | 39.98 | 40.31 | 40.64 | 40.97 | 41.30 | 41.63 | 41.96 |
| Woodie | 35.59 | 37.80 | 39.18 | 41.39 | 42.77 | 44.98 | 46.36 |
| Fibonacci | 37.94 | 39.32 | 40.16 | 41.53 | 42.91 | 43.75 | 45.12 |
| Pivot points | S3 | S2 | S1 | PP | R1 | R2 | R3 |
|---|---|---|---|---|---|---|---|
| Standard | 27.95 | 30.87 | 34.77 | 37.69 | 41.59 | 44.51 | 48.41 |
| Camarilla | 36.81 | 37.43 | 38.06 | 38.68 | 39.31 | 39.93 | 40.56 |
| Woodie | 28.45 | 31.12 | 35.27 | 37.94 | 42.09 | 44.76 | 48.91 |
| Fibonacci | 30.87 | 33.47 | 35.08 | 37.69 | 40.29 | 41.90 | 44.51 |
Numerical data
The following is the status of technical indicators and moving averages registered at the time this technical analysis was created:
| RSI (14): | 54.42 | |
| MACD (12,26,9): | 1.2200 | |
| Directional Movement: | -0.17 | |
| AROON (14): | 71.43 | |
| DEMA (21): | 42.27 | |
| Parabolic SAR (0,02-0,02-0,2): | 43.61 | |
| Elder Ray (13): | -0.49 | |
| Super Trend (3,10): | 38.70 | |
| Zig ZAG (10): | 40.97 | |
| VORTEX (21): | 1.0600 | |
| Stochastique (14,3,5): | 70.96 | |
| TEMA (21): | 42.47 | |
| Williams %R (14): | -45.13 | |
| Chande Momentum Oscillator (20): | 0.85 | |
| Repulse (5,40,3): | -1.3400 | |
| ROCnROLL: | -1 | |
| TRIX (15,9): | 0.4700 | |
| Courbe Coppock: | 14.44 |
| MA7: | 42.25 | |
| MA20: | 40.60 | |
| MA50: | 38.37 | |
| MA100: | 34.58 | |
| MAexp7: | 41.69 | |
| MAexp20: | 40.64 | |
| MAexp50: | 38.35 | |
| MAexp100: | 35.22 | |
| Price / MA7: | -3.03% | |
| Price / MA20: | +0.91% | |
| Price / MA50: | +6.78% | |
| Price / MA100: | +18.48% | |
| Price / MAexp7: | -1.73% | |
| Price / MAexp20: | +0.81% | |
| Price / MAexp50: | +6.83% | |
| Price / MAexp100: | +16.33% |
News
The latest news and videos published on SYNCHRONY FINANCIAL at the time of the analysis were as follows:
- Shuman, Glenn & Stecker Investigates Synchrony Financial
- Synchrony to Participate in the KBW Fintech Payments Conference
- Synchrony Announces Quarterly Common Stock Dividend of $0.22 Per Share
- Synchrony Reports Third Quarter Net Earnings of $313 Million or $0.52 Per Diluted Share
- Synchrony to Announce Third Quarter 2020 Financial Results on October 20, 2020
About author

Online


Add a comment
Comments
0 comments on the analysis SYNCHRONY FINANCIAL - Daily