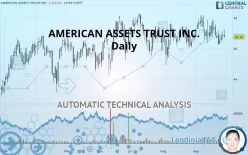
AMERICAN ASSETS TRUST INC. - Daily - Technical analysis published on 10/01/2019 (GMT)
- 271
- 0
- Who voted?
Click here for a new analysis!
- Timeframe : Daily
- - Analysis generated on
- Status : LEVEL MAINTAINED

Summary of the analysis

Additional analysis
Quotes
The AMERICAN ASSETS TRUST INC. price is 46.74 USD. On the day, this instrument lost -0.21% and was traded between 46.69 USD and 47.22 USD over the period. The price is currently at +0.11% from its lowest and -1.02% from its highest.A study of price movements over other periods shows the following variations:
Near a new HIGH record (5 years)
Type : Bullish
Timeframe : Weekly
Near a new HIGH record (1 year)
Type : Bullish
Timeframe : Weekly
Near a new HIGH record (1st january)
Type : Bullish
Timeframe : Weekly
Technical
A technical analysis in Daily of this AMERICAN ASSETS TRUST INC. chart shows a bullish trend. 75% of the signals given by moving averages are bullish. Caution: the neutral signals currently given by short-term moving averages show us that the global trend is losing momentum. The Central Indicators market scanner currently does not detect any result that concerns moving averages.
The probability of a further decline is low given the direction of the technical indicators.
Other results related to technical indicators were also found by the Central Indicators scanner:
RSI indicator is back over 50
Type : Bullish
Timeframe : Daily
Price is back over the pivot point
Type : Bullish
Timeframe : Weekly
Price is back under the pivot point
Type : Bearish
Timeframe : Daily
Momentum indicator is back over 0
Type : Bullish
Timeframe : Daily
No signals are given by Central Patterns, a market scanner specialised in chart patterns, resistances and supports.
No result was found by the Central Candlesticks scanner on Japanese candlesticks.
| S3 | S2 | S1 | Price | R1 | |
|---|---|---|---|---|---|
| ProTrendLines | 42.23 | 43.69 | 45.95 | 46.74 | 48.22 |
| Change (%) | -9.65% | -6.53% | -1.69% | - | +3.17% |
| Change | -4.51 | -3.05 | -0.79 | - | +1.48 |
| Level | Minor | Minor | Major | - | Major |
Attention could also be paid to pivot points to set price objectives:
| Pivot points | S3 | S2 | S1 | PP | R1 | R2 | R3 |
|---|---|---|---|---|---|---|---|
| Standard | 45.98 | 46.27 | 46.56 | 46.85 | 47.14 | 47.43 | 47.72 |
| Camarilla | 46.68 | 46.73 | 46.79 | 46.84 | 46.89 | 46.95 | 47.00 |
| Woodie | 45.97 | 46.27 | 46.55 | 46.85 | 47.13 | 47.43 | 47.71 |
| Fibonacci | 46.27 | 46.50 | 46.63 | 46.85 | 47.08 | 47.21 | 47.43 |
| Pivot points | S3 | S2 | S1 | PP | R1 | R2 | R3 |
|---|---|---|---|---|---|---|---|
| Standard | 45.38 | 45.79 | 46.32 | 46.73 | 47.26 | 47.67 | 48.20 |
| Camarilla | 46.58 | 46.67 | 46.75 | 46.84 | 46.93 | 47.01 | 47.10 |
| Woodie | 45.43 | 45.82 | 46.37 | 46.76 | 47.31 | 47.70 | 48.25 |
| Fibonacci | 45.79 | 46.15 | 46.37 | 46.73 | 47.09 | 47.31 | 47.67 |
| Pivot points | S3 | S2 | S1 | PP | R1 | R2 | R3 |
|---|---|---|---|---|---|---|---|
| Standard | 42.32 | 43.48 | 45.03 | 46.19 | 47.74 | 48.90 | 50.46 |
| Camarilla | 45.84 | 46.09 | 46.34 | 46.58 | 46.83 | 47.08 | 47.33 |
| Woodie | 42.51 | 43.57 | 45.23 | 46.29 | 47.94 | 49.00 | 50.65 |
| Fibonacci | 43.48 | 44.51 | 45.15 | 46.19 | 47.23 | 47.87 | 48.90 |
Numerical data
The following is the status of technical indicators and moving averages registered at the time this technical analysis was created:
| RSI (14): | 49.13 | |
| MACD (12,26,9): | 0.0000 | |
| Directional Movement: | 3.42 | |
| AROON (14): | -71.43 | |
| DEMA (21): | 46.86 | |
| Parabolic SAR (0,02-0,02-0,2): | 47.71 | |
| Elder Ray (13): | 0.14 | |
| Super Trend (3,10): | 48.12 | |
| Zig ZAG (10): | 46.74 | |
| VORTEX (21): | 1.0200 | |
| Stochastique (14,3,5): | 34.70 | |
| TEMA (21): | 46.78 | |
| Williams %R (14): | -68.26 | |
| Chande Momentum Oscillator (20): | -0.40 | |
| Repulse (5,40,3): | -1.0400 | |
| ROCnROLL: | -1 | |
| TRIX (15,9): | 0.0200 | |
| Courbe Coppock: | 1.62 |
| MA7: | 46.69 | |
| MA20: | 47.00 | |
| MA50: | 46.66 | |
| MA100: | 46.36 | |
| MAexp7: | 46.77 | |
| MAexp20: | 46.83 | |
| MAexp50: | 46.68 | |
| MAexp100: | 46.12 | |
| Price / MA7: | +0.11% | |
| Price / MA20: | -0.55% | |
| Price / MA50: | +0.17% | |
| Price / MA100: | +0.82% | |
| Price / MAexp7: | -0.06% | |
| Price / MAexp20: | -0.19% | |
| Price / MAexp50: | +0.13% | |
| Price / MAexp100: | +1.34% |
News
Don"t forget to follow the news on AMERICAN ASSETS TRUST INC.. At the time of publication of this analysis, the latest news was as follows:
- SOL Global Investments CEO Issues Statement on Sale of Latin American Assets
- NetworkNewsAudio Announces Audio Press Release (APR) on First Cobalt Corp.’s North American Assets and Ethical Source Potential
- American Assets Trust, Inc. to Host Earnings Call
- American Assets Trust, Inc. to Host Earnings Call
- Investor Network: American Assets Trust, Inc. to Host Earnings Call
About author

Online


Add a comment
Comments
0 comments on the analysis AMERICAN ASSETS TRUST INC. - Daily