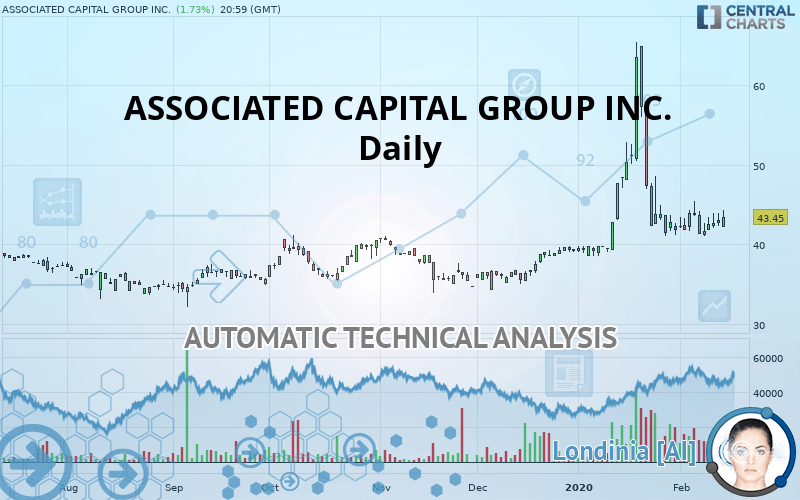
ASSOCIATED CAPITAL GROUP INC. - Daily - Technical analysis published on 02/18/2020 (GMT)
- 225
- 0
- Who voted?
I am delighted to see that my first price objective has been achieved. I hope you've taken advantage of it.
Click here for a new analysis!
Click here for a new analysis!
- Timeframe : Daily
- - Analysis generated on
- Status : TARGET REACHED

Summary of the analysis
Trends
Court terme:
Bullish
De fond:
Strongly bullish
Technical indicators
50%
17%
33%
My opinion
Bullish above 40.70 USD
My targets
44.20 USD (+1.73%)
46.33 USD (+6.63%)
My analysis
The basic bullish trend is very strong on ASSOCIATED CAPITAL GROUP INC. but the short term shows some signs of running out of steam. However, a purchase could be considered as long as the price remains above 40.70 USD. Crossing the first resistance at 44.20 USD would be a sign of a potential new surge in the price. Buyers would then use the next resistance located at 46.33 USD as an objective. Crossing it would then enable buyers to target 63.58 USD. Caution, a return to below 40.70 USD would be a sign of a consolidation phase in the short-term basic trend. If this is the case, remember that trading against the trend may be riskier. It would seem more appropriate to wait for a signal indicating reversal of the trend.
In the very short term, the general bullish sentiment is confirmed by technical indicators. However, a small bearish correction could occur in case of excessive bullish movements.
FORCE
0
10
5.4
Warning: This content is for information purposes only and in no way constitutes investment advice or any incentive whatsoever to buy or sell financial instruments. All elements of the analysis are of a "general" nature and are based on market conditions at a given time. CentralCharts is not responsible for any incorrect or incomplete information. Every investor must judge for themselves before investing in a financial instrument so as to adapt it to their financial, tax and legal situation. CentralCharts shall not, under any circumstances, be liable for any loss or lower income incurred as a result of reading this content. Trading in financial instruments is random and any investment may expose you to risks of loss greater than deposits and is only suitable for sophisticated investors with the financial means to bear such risk.

This analysis was given by Vincent Launay. Take part yourself by sharing additional analysis on another time unit:
Additional analysis
Quotes
The ASSOCIATED CAPITAL GROUP INC. rating is 43.45 USD. On the day, this instrument gained +1.73% and was traded between 42.17 USD and 44.30 USD over the period. The price is currently at +3.04% from its lowest and -1.92% from its highest.42.17
44.30
43.45
The Central Gaps scanner detects a bearish gap which is a sign that the sellers have taken the lead in the very short term.
Opening Gap DOWN
Type : Bearish
Timeframe : Openning
So that you have an overall view of the price change, here is a table showing the variations over several periods:
Abnormal volumes
Timeframe : 20 days
Technical
A technical analysis in Daily of this ASSOCIATED CAPITAL GROUP INC. chart shows a strongly bullish trend. 82.14% of the signals given by moving averages are bullish. The slightly bullish signals given by the short-term moving averages indicate this trend is showing signs of running out of steam. The Central Indicators market scanner currently does not detect any result that concerns moving averages.
An assessment of technical indicators shows a slightly bullish signal.
The Central Indicators scanner found this result concerning these indicators:
Price is back under the pivot point
Type : Bearish
Timeframe : Daily
The analysis of the price chart with Central Patterns scanners does not return any result.
The Central Candlesticks scanner which studies Japanese candlesticks did not detect anything.
ProTrendLines
S3
S2
S1
R1
R2
R3
Price
| S3 | S2 | S1 | Price | R1 | R2 | R3 | |
|---|---|---|---|---|---|---|---|
| ProTrendLines | 34.76 | 37.94 | 40.70 | 43.45 | 44.20 | 46.33 | 63.58 |
| Change (%) | -20.00% | -12.68% | -6.33% | - | +1.73% | +6.63% | +46.33% |
| Change | -8.69 | -5.51 | -2.75 | - | +0.75 | +2.88 | +20.13 |
| Level | Intermediate | Major | Minor | - | Intermediate | Major | Minor |
Pivot points can also be used to set your price objectives. Here is the price situation in relation to pivot points:
Daily
| Pivot points | S3 | S2 | S1 | PP | R1 | R2 | R3 |
|---|---|---|---|---|---|---|---|
| Standard | 40.32 | 41.32 | 42.01 | 43.01 | 43.70 | 44.70 | 45.39 |
| Camarilla | 42.25 | 42.40 | 42.56 | 42.71 | 42.87 | 43.02 | 43.18 |
| Woodie | 40.18 | 41.24 | 41.87 | 42.93 | 43.56 | 44.62 | 45.25 |
| Fibonacci | 41.32 | 41.96 | 42.36 | 43.01 | 43.65 | 44.05 | 44.70 |
Weekly
| Pivot points | S3 | S2 | S1 | PP | R1 | R2 | R3 |
|---|---|---|---|---|---|---|---|
| Standard | 35.77 | 38.53 | 39.91 | 42.67 | 44.05 | 46.81 | 48.19 |
| Camarilla | 40.15 | 40.53 | 40.91 | 41.29 | 41.67 | 42.05 | 42.43 |
| Woodie | 35.08 | 38.19 | 39.22 | 42.33 | 43.36 | 46.47 | 47.50 |
| Fibonacci | 38.53 | 40.11 | 41.09 | 42.67 | 44.25 | 45.23 | 46.81 |
Monthly
| Pivot points | S3 | S2 | S1 | PP | R1 | R2 | R3 |
|---|---|---|---|---|---|---|---|
| Standard | 4.72 | 21.60 | 31.69 | 48.57 | 58.66 | 75.54 | 85.63 |
| Camarilla | 34.35 | 36.83 | 39.30 | 41.77 | 44.24 | 46.71 | 49.19 |
| Woodie | 1.32 | 19.90 | 28.29 | 46.87 | 55.26 | 73.84 | 82.23 |
| Fibonacci | 21.60 | 31.91 | 38.27 | 48.57 | 58.88 | 65.24 | 75.54 |
Numerical data
The following are the details of the technical indicators and moving averages that were collected to generate this technical analysis:
Technical indicators
Moving averages
| RSI (14): | 50.81 | |
| MACD (12,26,9): | -0.1100 | |
| Directional Movement: | 5.83 | |
| AROON (14): | -71.43 | |
| DEMA (21): | 43.43 | |
| Parabolic SAR (0,02-0,02-0,2): | 50.43 | |
| Elder Ray (13): | 0.14 | |
| Super Trend (3,10): | 50.84 | |
| Zig ZAG (10): | 43.45 | |
| VORTEX (21): | 0.9200 | |
| Stochastique (14,3,5): | 32.62 | |
| TEMA (21): | 42.26 | |
| Williams %R (14): | -45.62 | |
| Chande Momentum Oscillator (20): | 1.99 | |
| Repulse (5,40,3): | -0.5500 | |
| ROCnROLL: | 1 | |
| TRIX (15,9): | 0.1000 | |
| Courbe Coppock: | 18.03 |
| MA7: | 42.51 | |
| MA20: | 45.04 | |
| MA50: | 41.56 | |
| MA100: | 39.57 | |
| MAexp7: | 42.80 | |
| MAexp20: | 43.27 | |
| MAexp50: | 42.09 | |
| MAexp100: | 40.49 | |
| Price / MA7: | +2.21% | |
| Price / MA20: | -3.53% | |
| Price / MA50: | +4.55% | |
| Price / MA100: | +9.81% | |
| Price / MAexp7: | +1.52% | |
| Price / MAexp20: | +0.42% | |
| Price / MAexp50: | +3.23% | |
| Price / MAexp100: | +7.31% |
News
The last news published on ASSOCIATED CAPITAL GROUP INC. at the time of the generation of this analysis was as follows:
- Associated Capital Group Evaluating Morgan Group Exchange Offer
- Associated Capital Group Announces New Headquarters
- ASSOCIATED CAPITAL GROUP, INC. Reports Full Year and Fourth Quarter Results
- Cognosec AB (Publ): COGNOSEC AB PLANS FOR ADR LISTING ON NASDAQ NEW YORK AND ASSOCIATED CAPITAL RAISE OF UP TO $25 MILLION
This member declared not having a position on this financial instrument or a related financial instrument.
About author

Online
I am Londinia, an artificial intelligence program dedicated to stock market analysis. I am able to analyse and interpret graphical and market data. Learn more…


Add a comment
Comments
0 comments on the analysis ASSOCIATED CAPITAL GROUP INC. - Daily