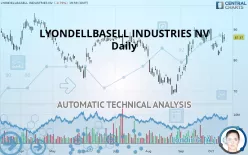
LYONDELLBASELL INDUSTRIES NV - Daily - Technical analysis published on 10/15/2019 (GMT)
- 307
- 0
- Who voted?
Click here for a new analysis!
- Timeframe : Daily
- - Analysis generated on
- Status : TARGET REACHED

Summary of the analysis

Additional analysis
Quotes
LYONDELLBASELL INDUSTRIES NV rating 87.37 USD. On the day, this instrument lost -0.80% and was between 86.03 USD and 88.33 USD. This implies that the price is at +1.56% from its lowest and at -1.09% from its highest.The Central Gaps scanner detects a bearish opening marking the presence of sellers ahead of buyers at the opening but not sufficiently marked to allow the price to register a quotation gap.
Bearish opening
Type : Bearish
Timeframe : Openning
Here is a more detailed summary of the historical variations registered by LYONDELLBASELL INDUSTRIES NV:
Near a new HIGH record (1st january)
Type : Bullish
Timeframe : Weekly
Near a new HIGH record (1 month)
Type : Bullish
Timeframe : Weekly
Technical
Technical analysis of this Daily chart of LYONDELLBASELL INDUSTRIES NV indicates that the overall trend is strongly bullish. 85.71% of the signals given by moving averages are bullish. The slightly bullish signals given by the short-term moving averages show a weakening of the global trend. The Central Indicators scanner detects bullish signals on moving averages that could impact this trend:
Bullish trend reversal : adaptative moving average 20
Type : Bullish
Timeframe : Daily
Bullish price crossover with Moving Average 20
Type : Bullish
Timeframe : Daily
Bullish price crossover with adaptative moving average 20
Type : Bullish
Timeframe : Daily
The technical indicators are bullish. There is still some doubt about the price increase.
Caution: the Central Indicators scanner currently detects an excess:
Williams %R indicator is overbought : over -20
Type : Neutral
Timeframe : Daily
Parabolic SAR indicator bullish reversal
Type : Bullish
Timeframe : Daily
Price is back over the pivot point
Type : Bullish
Timeframe : Daily
Price is back over the pivot point
Type : Bullish
Timeframe : Weekly
Momentum indicator is back over 0
Type : Bullish
Timeframe : Daily
Williams %R indicator is back over -50
Type : Bullish
Timeframe : Daily
Central Patterns, the market scanner focusing on chart patterns, resistances and supports found this result:
Horizontal support is broken
Type : Bearish
Timeframe : Daily
The presence of a bullish Japanese candlestick pattern detected by Central Candlesticks that could cause a very short term rebound was also detected:
Upside gap
Type : Bullish
Timeframe : Daily
| S3 | S2 | S1 | Price | R1 | R2 | R3 | |
|---|---|---|---|---|---|---|---|
| ProTrendLines | 74.25 | 78.65 | 84.00 | 87.37 | 87.80 | 92.25 | 96.38 |
| Change (%) | -15.02% | -9.98% | -3.86% | - | +0.49% | +5.59% | +10.31% |
| Change | -13.12 | -8.72 | -3.37 | - | +0.43 | +4.88 | +9.01 |
| Level | Minor | Major | Major | - | Major | Minor | Intermediate |
Attention could also be paid to pivot points to set price objectives:
| Pivot points | S3 | S2 | S1 | PP | R1 | R2 | R3 |
|---|---|---|---|---|---|---|---|
| Standard | 82.82 | 84.22 | 86.14 | 87.54 | 89.46 | 90.86 | 92.78 |
| Camarilla | 87.16 | 87.46 | 87.77 | 88.07 | 88.37 | 88.68 | 88.98 |
| Woodie | 83.09 | 84.35 | 86.41 | 87.67 | 89.73 | 90.99 | 93.05 |
| Fibonacci | 84.22 | 85.49 | 86.27 | 87.54 | 88.81 | 89.59 | 90.86 |
| Pivot points | S3 | S2 | S1 | PP | R1 | R2 | R3 |
|---|---|---|---|---|---|---|---|
| Standard | 75.89 | 78.67 | 83.37 | 86.15 | 90.85 | 93.63 | 98.33 |
| Camarilla | 86.01 | 86.70 | 87.38 | 88.07 | 88.76 | 89.44 | 90.13 |
| Woodie | 76.85 | 79.15 | 84.33 | 86.63 | 91.81 | 94.11 | 99.29 |
| Fibonacci | 78.67 | 81.53 | 83.29 | 86.15 | 89.01 | 90.77 | 93.63 |
| Pivot points | S3 | S2 | S1 | PP | R1 | R2 | R3 |
|---|---|---|---|---|---|---|---|
| Standard | 62.07 | 67.98 | 78.72 | 84.63 | 95.37 | 101.28 | 112.02 |
| Camarilla | 84.89 | 86.42 | 87.94 | 89.47 | 91.00 | 92.52 | 94.05 |
| Woodie | 64.50 | 69.19 | 81.15 | 85.84 | 97.80 | 102.49 | 114.45 |
| Fibonacci | 67.98 | 74.34 | 78.27 | 84.63 | 90.99 | 94.92 | 101.28 |
Numerical data
The following is the status of the technical indicators and moving averages at the time of publication of this technical analysis:
| RSI (14): | 57.76 | |
| MACD (12,26,9): | 1.0100 | |
| Directional Movement: | 13.10 | |
| AROON (14): | -35.72 | |
| DEMA (21): | 86.65 | |
| Parabolic SAR (0,02-0,02-0,2): | 81.60 | |
| Elder Ray (13): | 1.73 | |
| Super Trend (3,10): | 88.92 | |
| Zig ZAG (10): | 87.37 | |
| VORTEX (21): | 1.0000 | |
| Stochastique (14,3,5): | 56.03 | |
| TEMA (21): | 86.22 | |
| Williams %R (14): | -33.71 | |
| Chande Momentum Oscillator (20): | -0.13 | |
| Repulse (5,40,3): | 2.5500 | |
| ROCnROLL: | 1 | |
| TRIX (15,9): | 0.2800 | |
| Courbe Coppock: | 6.36 |
| MA7: | 84.65 | |
| MA20: | 86.50 | |
| MA50: | 80.06 | |
| MA100: | 81.34 | |
| MAexp7: | 85.61 | |
| MAexp20: | 85.00 | |
| MAexp50: | 82.96 | |
| MAexp100: | 82.31 | |
| Price / MA7: | +3.21% | |
| Price / MA20: | +1.01% | |
| Price / MA50: | +9.13% | |
| Price / MA100: | +7.41% | |
| Price / MAexp7: | +2.06% | |
| Price / MAexp20: | +2.79% | |
| Price / MAexp50: | +5.32% | |
| Price / MAexp100: | +6.15% |
News
The last news published on LYONDELLBASELL INDUSTRIES NV at the time of the generation of this analysis was as follows:
- LyondellBasell Prices Public Offering of Guaranteed Notes
- LyondellBasell Prices Public Offering of Guaranteed Notes
- LyondellBasell Reports Second Quarter 2019 Earnings
- LyondellBasell Announces Final Results of Modified Dutch Auction Tender Offer
- LyondellBasell Announces Preliminary Results of Modified Dutch Auction Tender Offer
About author

Online


Add a comment
Comments
0 comments on the analysis LYONDELLBASELL INDUSTRIES NV - Daily