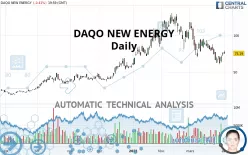
DAQO NEW ENERGY - Daily - Technical analysis published on 04/04/2021 (GMT)
- 356
- 0
Click here for a new analysis!
- Timeframe : Daily
- - Analysis generated on
- Status : TARGET REACHED

Summary of the analysis

Additional analysis
Quotes
The DAQO NEW ENERGY rating is 75.19 USD. The price registered a decrease of -0.41% on the session with the lowest point at 74.38 USD and the highest point at 79.20 USD. The deviation from the price is +1.09% for the low point and -5.06% for the high point.A bullish gap was detected at the opening by the Central Gaps scanner. There are a lot of buyers and they have the upper hand in the very short term.
Opening Gap UP
Type : Bullish
Timeframe : Openning
So that you have an overall view of the price change, here is a table showing the variations over several periods:
Technical
Technical analysis of DAQO NEW ENERGY in Daily shows a neutral overall trend. The trend could quickly turn bearish due to the strong bearish signals currently being given by short-term moving averages. The Central Indicators scanner detects a bullish signal on moving averages that could impact this trend:
Bullish trend reversal : adaptative moving average 100
Type : Bullish
Timeframe : Daily
An assessment of technical indicators does not currently provide any relevant information to suggest whether the signal given by the technical indicators is more bullish or bearish.
Caution: the Central Indicators scanner currently detects an excess:
Williams %R indicator is overbought : over -20
Type : Neutral
Timeframe : Daily
Pivot points : price is over resistance 2
Type : Neutral
Timeframe : Daily
Pivot points : price is under support 3
Type : Neutral
Timeframe : Daily
Pivot points : price is under support 3
Type : Neutral
Timeframe : Weekly
Parabolic SAR indicator bullish reversal
Type : Bullish
Timeframe : Daily
Price is back over the pivot point
Type : Bullish
Timeframe : Weekly
The analysis of the price chart with Central Patterns scanners does not return any result.
The Central Candlesticks scanner which studies Japanese candlesticks did not detect anything.
| S3 | S2 | S1 | Price | R1 | R2 | R3 | |
|---|---|---|---|---|---|---|---|
| ProTrendLines | 39.16 | 48.40 | 72.03 | 75.19 | 94.22 | 103.88 | 124.13 |
| Change (%) | -47.92% | -35.63% | -4.20% | - | +25.31% | +38.16% | +65.09% |
| Change | -36.03 | -26.79 | -3.16 | - | +19.03 | +28.69 | +48.94 |
| Level | Major | Intermediate | Major | - | Intermediate | Intermediate | Major |
Attention could also be paid to pivot points to set price objectives:
| Pivot points | S3 | S2 | S1 | PP | R1 | R2 | R3 |
|---|---|---|---|---|---|---|---|
| Standard | 68.49 | 71.44 | 73.31 | 76.26 | 78.13 | 81.08 | 82.95 |
| Camarilla | 73.87 | 74.31 | 74.75 | 75.19 | 75.63 | 76.07 | 76.52 |
| Woodie | 67.96 | 71.17 | 72.78 | 75.99 | 77.60 | 80.81 | 82.42 |
| Fibonacci | 71.44 | 73.28 | 74.42 | 76.26 | 78.10 | 79.24 | 81.08 |
| Pivot points | S3 | S2 | S1 | PP | R1 | R2 | R3 |
|---|---|---|---|---|---|---|---|
| Standard | 33.98 | 48.20 | 59.27 | 73.49 | 84.56 | 98.78 | 109.85 |
| Camarilla | 63.39 | 65.70 | 68.02 | 70.34 | 72.66 | 74.98 | 77.30 |
| Woodie | 32.41 | 47.41 | 57.70 | 72.70 | 82.99 | 97.99 | 108.28 |
| Fibonacci | 48.20 | 57.86 | 63.83 | 73.49 | 83.15 | 89.12 | 98.78 |
| Pivot points | S3 | S2 | S1 | PP | R1 | R2 | R3 |
|---|---|---|---|---|---|---|---|
| Standard | -6.07 | 27.25 | 51.37 | 84.69 | 108.81 | 142.13 | 166.25 |
| Camarilla | 59.70 | 64.97 | 70.24 | 75.50 | 80.77 | 86.03 | 91.30 |
| Woodie | -10.66 | 24.95 | 46.78 | 82.39 | 104.22 | 139.83 | 161.66 |
| Fibonacci | 27.25 | 49.19 | 62.75 | 84.69 | 106.63 | 120.19 | 142.13 |
Numerical data
The following is the status of the technical indicators and moving averages at the time of publication of this technical analysis:
| RSI (14): | 45.50 | |
| MACD (12,26,9): | -6.5300 | |
| Directional Movement: | -7.93 | |
| AROON (14): | -78.57 | |
| DEMA (21): | 70.77 | |
| Parabolic SAR (0,02-0,02-0,2): | 60.56 | |
| Elder Ray (13): | 1.27 | |
| Super Trend (3,10): | 96.02 | |
| Zig ZAG (10): | 75.19 | |
| VORTEX (21): | 0.8000 | |
| Stochastique (14,3,5): | 38.73 | |
| TEMA (21): | 66.12 | |
| Williams %R (14): | -55.44 | |
| Chande Momentum Oscillator (20): | -10.54 | |
| Repulse (5,40,3): | -4.0000 | |
| ROCnROLL: | -1 | |
| TRIX (15,9): | -1.0900 | |
| Courbe Coppock: | 34.97 |
| MA7: | 69.70 | |
| MA20: | 78.44 | |
| MA50: | 95.06 | |
| MA100: | 74.58 | |
| MAexp7: | 72.82 | |
| MAexp20: | 79.16 | |
| MAexp50: | 83.59 | |
| MAexp100: | 74.91 | |
| Price / MA7: | +7.88% | |
| Price / MA20: | -4.14% | |
| Price / MA50: | -20.90% | |
| Price / MA100: | +0.82% | |
| Price / MAexp7: | +3.25% | |
| Price / MAexp20: | -5.02% | |
| Price / MAexp50: | -10.05% | |
| Price / MAexp100: | +0.37% |
News
Don"t forget to follow the news on DAQO NEW ENERGY. At the time of publication of this analysis, the latest news was as follows:
- Daqo New Energy Announces Three-Year High-Purity Polysilicon Supply Agreement with Gaojing Solar
- Daqo New Energy Announces Three-Year High-Purity Polysilicon Supply Agreement with Wuxi Shangji Automation
- Thinking about trading options or stock in Apple, Square, Nio, Daqo New Energy, or Uber?
- Daqo New Energy Announces A Long-Term High-Purity Polysilicon Supply Agreement with Wuxi Shangji Automation
- Daqo New Energy Receives "2019 Strategic Partner Award" from LONGi Green Energy
About author

Online


Add a comment
Comments
0 comments on the analysis DAQO NEW ENERGY - Daily