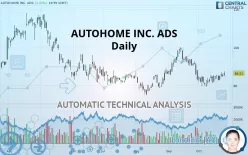
AUTOHOME INC. ADS - Daily - Technical analysis published on 10/25/2019 (GMT)
- 274
- 0
- Who voted?
- Timeframe : Daily
- - Analysis generated on
- Status : NEUTRAL

Summary of the analysis

Additional analysis
Quotes
AUTOHOME INC. ADS rating 86.51 USD. The price registered an increase of +1.22% on the session and was between 84.62 USD and 87.40 USD. This implies that the price is at +2.23% from its lowest and at -1.02% from its highest.The Central Gaps scanner detects a bullish opening. A small advantage for buyers in the very short term.
Bullish opening
Type : Bullish
Timeframe : Openning
Here is a more detailed summary of the historical variations registered by AUTOHOME INC. ADS:
Technical
Technical analysis of this Daily chart of AUTOHOME INC. ADS indicates that the overall trend is slightly bearish. 50% of the signals given by moving averages are bearish. Caution: the slightly bullish signals currently given by short-term moving averages could cause a reversal of the trend. An assessment of moving averages reveals a bearish signal that could impact this trend:
Bearish price crossover with Moving Average 100
Type : Bearish
Timeframe : Daily
In fact, 13 technical indicators on 18 studied are currently bullish. Caution: the Central Indicators scanner currently detects an excess:
Williams %R indicator is overbought : over -20
Type : Neutral
Timeframe : Daily
Pivot points : price is over resistance 1
Type : Neutral
Timeframe : Daily
Pivot points : price is over resistance 1
Type : Neutral
Timeframe : Weekly
RSI indicator is back under 50
Type : Bearish
Timeframe : Daily
Price is back under the pivot point
Type : Bearish
Timeframe : Weekly
Central Patterns, the market scanner focusing on chart patterns, resistances and supports found this result:
Near resistance of channel
Type : Bearish
Timeframe : Daily
No result was found by the Central Candlesticks scanner on Japanese candlesticks.
| S3 | S2 | S1 | Price | R1 | R2 | R3 | |
|---|---|---|---|---|---|---|---|
| ProTrendLines | 70.65 | 76.57 | 85.27 | 86.51 | 92.97 | 99.64 | 109.97 |
| Change (%) | -18.33% | -11.49% | -1.43% | - | +7.47% | +15.18% | +27.12% |
| Change | -15.86 | -9.94 | -1.24 | - | +6.46 | +13.13 | +23.46 |
| Level | Minor | Major | Major | - | Major | Intermediate | Minor |
Attention could also be paid to pivot points to set price objectives:
| Pivot points | S3 | S2 | S1 | PP | R1 | R2 | R3 |
|---|---|---|---|---|---|---|---|
| Standard | 82.66 | 83.56 | 84.52 | 85.42 | 86.38 | 87.28 | 88.24 |
| Camarilla | 84.96 | 85.13 | 85.30 | 85.47 | 85.64 | 85.81 | 85.98 |
| Woodie | 82.68 | 83.58 | 84.54 | 85.44 | 86.40 | 87.30 | 88.26 |
| Fibonacci | 83.56 | 84.27 | 84.71 | 85.42 | 86.13 | 86.57 | 87.28 |
| Pivot points | S3 | S2 | S1 | PP | R1 | R2 | R3 |
|---|---|---|---|---|---|---|---|
| Standard | 76.39 | 78.79 | 80.87 | 83.27 | 85.35 | 87.75 | 89.83 |
| Camarilla | 81.72 | 82.13 | 82.54 | 82.95 | 83.36 | 83.77 | 84.18 |
| Woodie | 76.23 | 78.71 | 80.71 | 83.19 | 85.19 | 87.67 | 89.67 |
| Fibonacci | 78.79 | 80.50 | 81.56 | 83.27 | 84.98 | 86.04 | 87.75 |
| Pivot points | S3 | S2 | S1 | PP | R1 | R2 | R3 |
|---|---|---|---|---|---|---|---|
| Standard | 59.95 | 71.38 | 77.25 | 88.68 | 94.55 | 105.98 | 111.85 |
| Camarilla | 78.37 | 79.96 | 81.54 | 83.13 | 84.72 | 86.30 | 87.89 |
| Woodie | 57.18 | 69.99 | 74.48 | 87.29 | 91.78 | 104.59 | 109.08 |
| Fibonacci | 71.38 | 77.99 | 82.07 | 88.68 | 95.29 | 99.37 | 105.98 |
Numerical data
The following is the status of the technical indicators and moving averages at the time of publication of this technical analysis:
| RSI (14): | 52.27 | |
| MACD (12,26,9): | -0.5900 | |
| Directional Movement: | 0.53 | |
| AROON (14): | 85.71 | |
| DEMA (21): | 84.32 | |
| Parabolic SAR (0,02-0,02-0,2): | 80.70 | |
| Elder Ray (13): | 1.05 | |
| Super Trend (3,10): | 91.26 | |
| Zig ZAG (10): | 86.51 | |
| VORTEX (21): | 0.8700 | |
| Stochastique (14,3,5): | 84.88 | |
| TEMA (21): | 84.06 | |
| Williams %R (14): | -11.08 | |
| Chande Momentum Oscillator (20): | 6.48 | |
| Repulse (5,40,3): | 2.8000 | |
| ROCnROLL: | 1 | |
| TRIX (15,9): | -0.2000 | |
| Courbe Coppock: | 3.58 |
| MA7: | 85.10 | |
| MA20: | 83.80 | |
| MA50: | 86.88 | |
| MA100: | 85.83 | |
| MAexp7: | 85.22 | |
| MAexp20: | 85.27 | |
| MAexp50: | 86.15 | |
| MAexp100: | 87.00 | |
| Price / MA7: | +1.66% | |
| Price / MA20: | +3.23% | |
| Price / MA50: | -0.43% | |
| Price / MA100: | +0.79% | |
| Price / MAexp7: | +1.51% | |
| Price / MAexp20: | +1.45% | |
| Price / MAexp50: | +0.42% | |
| Price / MAexp100: | -0.56% |
News
Don"t forget to follow the news on AUTOHOME INC. ADS. At the time of publication of this analysis, the latest news was as follows:
- Autohome Inc. Announces Unaudited Second Quarter Ended June 30, 2019 Financial Results
- Autohome Inc. to Announce Second Quarter 2019 Financial Results on August 7, 2019
- Autohome Inc. Announces Unaudited First Quarter Ended March 31, 2019 Financial Results
- Autohome Inc. to Announce First Quarter 2019 Financial Results on May 8, 2019
- Autohome Inc. Files Its Annual Report on Form 20-F
About author

Online


Add a comment
Comments
0 comments on the analysis AUTOHOME INC. ADS - Daily