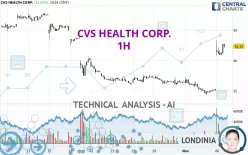
CVS HEALTH CORP. - 1H - Technical analysis published on 11/06/2024 (GMT)
- 112
- 0
Click here for a new analysis!
- Timeframe : 1H
- - Analysis generated on
- Status : INVALID

Summary of the analysis

Additional analysis
Quotes
CVS HEALTH CORP. rating 62.33 USD. On the day, this instrument gained +12.63% with the lowest point at 60.82 USD and the highest point at 63.33 USD. The deviation from the price is +2.48% for the low point and -1.58% for the high point.A bullish gap was detected at the opening by the Central Gaps scanner. There are a lot of buyers and they have the upper hand in the very short term.
Opening Gap UP
Type : Bullish
Timeframe : Openning
So that you have an overall view of the price change, here is a table showing the variations over several periods:
Technical
Technical analysis of CVS HEALTH CORP. in 1H shows an overall bullish trend. The signals returned by the moving averages are 67.86% bullish. This bullish trend is reinforced by the strong signals currently being given by short-term moving averages. The Central Indicators scanner does not detect any result on moving averages that would impact this trend.
In fact, 17 technical indicators on 18 studied are currently positioned bullish. Caution: the Central Indicators scanner currently detects an excess:
CCI indicator is overbought : over 100
Type : Neutral
Timeframe : 1 hour
RSI indicator: bearish divergence
Type : Bearish
Timeframe : 1 hour
Williams %R indicator is overbought : over -20
Type : Neutral
Timeframe : 1 hour
Pivot points : price is over resistance 3
Type : Neutral
Timeframe : 1 hour
Pivot points : price is over resistance 3
Type : Neutral
Timeframe : Weekly
Central Patterns, the market scanner focusing on chart patterns, resistances and supports found this result:
Resistance of channel is broken
Type : Bullish
Timeframe : 1 hour
For a small setback in the very short term, the Central Candlesticks scanner currently notes the presence of this bearish pattern in Japanese candlesticks:
Bearish doji star
Type : Bearish
Timeframe : 1 hour
| S3 | S2 | S1 | Price | R1 | R2 | R3 | |
|---|---|---|---|---|---|---|---|
| ProTrendLines | 54.31 | 55.31 | 58.86 | 62.33 | 62.89 | 65.48 | 66.71 |
| Change (%) | -12.87% | -11.26% | -5.57% | - | +0.90% | +5.05% | +7.03% |
| Change | -8.02 | -7.02 | -3.47 | - | +0.56 | +3.15 | +4.38 |
| Level | Intermediate | Major | Major | - | Minor | Minor | Intermediate |
To determine price objectives, it is also possible to use the pivot points. Here is the price position in relation to pivot points:
| Pivot points | S3 | S2 | S1 | PP | R1 | R2 | R3 |
|---|---|---|---|---|---|---|---|
| Standard | 53.61 | 53.96 | 54.65 | 55.00 | 55.69 | 56.04 | 56.73 |
| Camarilla | 55.05 | 55.15 | 55.25 | 55.34 | 55.44 | 55.53 | 55.63 |
| Woodie | 53.78 | 54.05 | 54.82 | 55.09 | 55.86 | 56.13 | 56.90 |
| Fibonacci | 53.96 | 54.36 | 54.60 | 55.00 | 55.40 | 55.64 | 56.04 |
| Pivot points | S3 | S2 | S1 | PP | R1 | R2 | R3 |
|---|---|---|---|---|---|---|---|
| Standard | 52.95 | 54.28 | 55.05 | 56.38 | 57.15 | 58.48 | 59.25 |
| Camarilla | 55.23 | 55.43 | 55.62 | 55.81 | 56.00 | 56.20 | 56.39 |
| Woodie | 52.66 | 54.14 | 54.76 | 56.24 | 56.86 | 58.34 | 58.96 |
| Fibonacci | 54.28 | 55.09 | 55.58 | 56.38 | 57.19 | 57.68 | 58.48 |
| Pivot points | S3 | S2 | S1 | PP | R1 | R2 | R3 |
|---|---|---|---|---|---|---|---|
| Standard | 41.49 | 48.71 | 52.59 | 59.81 | 63.69 | 70.91 | 74.79 |
| Camarilla | 53.41 | 54.43 | 55.44 | 56.46 | 57.48 | 58.50 | 59.51 |
| Woodie | 39.81 | 47.88 | 50.91 | 58.98 | 62.01 | 70.08 | 73.11 |
| Fibonacci | 48.71 | 52.95 | 55.57 | 59.81 | 64.05 | 66.67 | 70.91 |
Numerical data
The following is the status of the technical indicators and moving averages at the time of publication of this technical analysis:
| RSI (14): | 82.22 | |
| MACD (12,26,9): | 1.3000 | |
| Directional Movement: | 47.73 | |
| AROON (14): | 50.00 | |
| DEMA (21): | 59.08 | |
| Parabolic SAR (0,02-0,02-0,2): | 57.25 | |
| Elder Ray (13): | 3.08 | |
| Super Trend (3,10): | 58.66 | |
| Zig ZAG (10): | 62.17 | |
| VORTEX (21): | 0.9800 | |
| Stochastique (14,3,5): | 79.31 | |
| TEMA (21): | 60.47 | |
| Williams %R (14): | -11.75 | |
| Chande Momentum Oscillator (20): | 7.60 | |
| Repulse (5,40,3): | 1.5900 | |
| ROCnROLL: | 1 | |
| TRIX (15,9): | 0.1000 | |
| Courbe Coppock: | 15.84 |
| MA7: | 56.74 | |
| MA20: | 59.44 | |
| MA50: | 59.09 | |
| MA100: | 58.48 | |
| MAexp7: | 60.02 | |
| MAexp20: | 57.79 | |
| MAexp50: | 57.14 | |
| MAexp100: | 57.84 | |
| Price / MA7: | +9.85% | |
| Price / MA20: | +4.86% | |
| Price / MA50: | +5.48% | |
| Price / MA100: | +6.58% | |
| Price / MAexp7: | +3.85% | |
| Price / MAexp20: | +7.86% | |
| Price / MAexp50: | +9.08% | |
| Price / MAexp100: | +7.76% |
News
Don't forget to follow the news on CVS HEALTH CORP.. At the time of publication of this analysis, the latest news was as follows:
- CVS HEALTH CORPORATION REPORTS THIRD QUARTER 2024 RESULTS
- CVS Health Announces Leadership Appointments
- CVS Health Foundation helps address barriers to care for patients with chronic diseases in Atlanta
- CVS Health Appoints David Joyner President and Chief Executive Officer
- Aetna introduces SimplePay Health
About author
Online


Add a comment
Comments
0 comments on the analysis CVS HEALTH CORP. - 1H