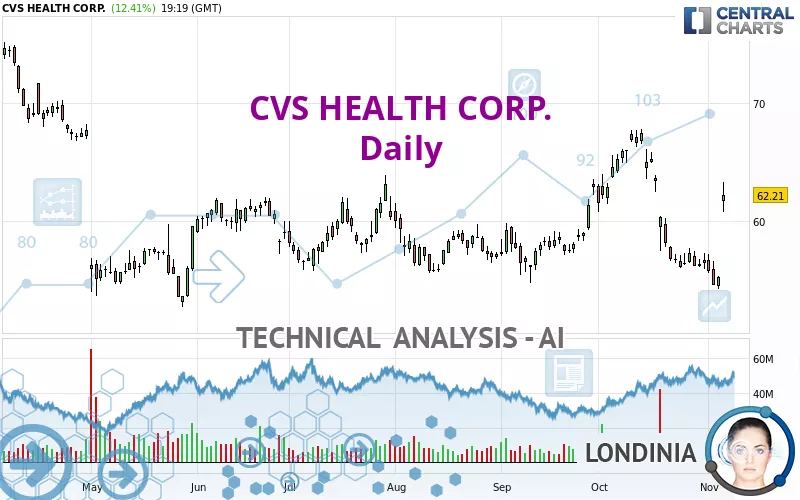
CVS HEALTH CORP. - Daily - Technical analysis published on 11/06/2024 (GMT)
- 136
- 0
Click here for a new analysis!
- Timeframe : Daily
- - Analysis generated on
- Status : INVALID
Summary of the analysis

Additional analysis
Quotes
The CVS HEALTH CORP. rating is 62.20 USD. The price registered an increase of +12.40% on the session and was between 60.82 USD and 63.33 USD. This implies that the price is at +2.27% from its lowest and at -1.78% from its highest.The Central Gaps scanner detects the formation of a bullish gap marking the strong presence of buyers against sellers at the opening. This formed a quotation gap.
Opening Gap UP
Type : Bullish
Timeframe : Openning
A study of price movements over other periods shows the following variations:
Technical
A technical analysis in Daily of this CVS HEALTH CORP. chart shows a bullish trend. 78.57% of the signals given by moving averages are bullish. The overall trend seems to be showing some signs of weakness, as do the tentative bullish signals given by short-term moving averages. An assessment of moving averages reveals several bullish signals that could impact this trend:
Bullish price crossover with Moving Average 20
Type : Bullish
Timeframe : Daily
Bullish price crossover with Moving Average 50
Type : Bullish
Timeframe : Daily
Bullish price crossover with Moving Average 100
Type : Bullish
Timeframe : Daily
Bullish price crossover with adaptative moving average 20
Type : Bullish
Timeframe : Daily
Bullish price crossover with adaptative moving average 50
Type : Bullish
Timeframe : Daily
Bullish price crossover with adaptative moving average 100
Type : Bullish
Timeframe : Daily
In fact, 10 technical indicators on 18 studied are currently positioned bullish. Caution: the Central Indicators scanner currently detects an excess:
Williams %R indicator is overbought : over -20
Type : Neutral
Timeframe : Daily
Pivot points : price is over resistance 3
Type : Neutral
Timeframe : Daily
Pivot points : price is over resistance 3
Type : Neutral
Timeframe : Weekly
RSI indicator is back over 50
Type : Bullish
Timeframe : Daily
Parabolic SAR indicator bullish reversal
Type : Bullish
Timeframe : Daily
Aroon indicator bullish trend
Type : Bullish
Timeframe : Daily
Ichimoku : price is over the cloud
Type : Bullish
Timeframe : Daily
SuperTrend indicator bullish reversal
Type : Bullish
Timeframe : Daily
Momentum indicator is back over 0
Type : Bullish
Timeframe : Daily
The Central Patterns scanner, which studies chart patterns, resistances and supports, has identified these signals:
Horizontal resistance is broken
Type : Bullish
Timeframe : Daily
Resistance of channel is broken
Type : Bullish
Timeframe : Daily
The presence of these bullish Japanese candlestick patterns detected by Central Candlesticks that could cause a very short term rebound were also noted:
White morning star
Type : Bullish
Timeframe : Daily
Upside gap
Type : Bullish
Timeframe : Daily
| S3 | S2 | S1 | Price | R1 | R2 | R3 | |
|---|---|---|---|---|---|---|---|
| ProTrendLines | 52.44 | 55.31 | 58.86 | 62.20 | 66.71 | 68.60 | 73.34 |
| Change (%) | -15.69% | -11.08% | -5.37% | - | +7.25% | +10.29% | +17.91% |
| Change | -9.76 | -6.89 | -3.34 | - | +4.51 | +6.40 | +11.14 |
| Level | Intermediate | Major | Major | - | Intermediate | Intermediate | Minor |
Attention could also be paid to pivot points to set price objectives:
| Pivot points | S3 | S2 | S1 | PP | R1 | R2 | R3 |
|---|---|---|---|---|---|---|---|
| Standard | 53.61 | 53.96 | 54.65 | 55.00 | 55.69 | 56.04 | 56.73 |
| Camarilla | 55.05 | 55.15 | 55.25 | 55.34 | 55.44 | 55.53 | 55.63 |
| Woodie | 53.78 | 54.05 | 54.82 | 55.09 | 55.86 | 56.13 | 56.90 |
| Fibonacci | 53.96 | 54.36 | 54.60 | 55.00 | 55.40 | 55.64 | 56.04 |
| Pivot points | S3 | S2 | S1 | PP | R1 | R2 | R3 |
|---|---|---|---|---|---|---|---|
| Standard | 52.95 | 54.28 | 55.05 | 56.38 | 57.15 | 58.48 | 59.25 |
| Camarilla | 55.23 | 55.43 | 55.62 | 55.81 | 56.00 | 56.20 | 56.39 |
| Woodie | 52.66 | 54.14 | 54.76 | 56.24 | 56.86 | 58.34 | 58.96 |
| Fibonacci | 54.28 | 55.09 | 55.58 | 56.38 | 57.19 | 57.68 | 58.48 |
| Pivot points | S3 | S2 | S1 | PP | R1 | R2 | R3 |
|---|---|---|---|---|---|---|---|
| Standard | 41.49 | 48.71 | 52.59 | 59.81 | 63.69 | 70.91 | 74.79 |
| Camarilla | 53.41 | 54.43 | 55.44 | 56.46 | 57.48 | 58.50 | 59.51 |
| Woodie | 39.81 | 47.88 | 50.91 | 58.98 | 62.01 | 70.08 | 73.11 |
| Fibonacci | 48.71 | 52.95 | 55.57 | 59.81 | 64.05 | 66.67 | 70.91 |
Numerical data
The following is the status of technical indicators and moving averages registered at the time this technical analysis was created:
| RSI (14): | 60.39 | |
| MACD (12,26,9): | -0.9500 | |
| Directional Movement: | 14.42 | |
| AROON (14): | 7.14 | |
| DEMA (21): | 57.33 | |
| Parabolic SAR (0,02-0,02-0,2): | 54.31 | |
| Elder Ray (13): | 4.22 | |
| Super Trend (3,10): | 55.39 | |
| Zig ZAG (10): | 62.26 | |
| VORTEX (21): | 0.8000 | |
| Stochastique (14,3,5): | 33.05 | |
| TEMA (21): | 56.28 | |
| Williams %R (14): | -11.75 | |
| Chande Momentum Oscillator (20): | 4.08 | |
| Repulse (5,40,3): | -0.4600 | |
| ROCnROLL: | 1 | |
| TRIX (15,9): | -0.2100 | |
| Courbe Coppock: | 18.75 |
| MA7: | 56.74 | |
| MA20: | 59.44 | |
| MA50: | 59.09 | |
| MA100: | 58.48 | |
| MAexp7: | 57.58 | |
| MAexp20: | 58.42 | |
| MAexp50: | 58.98 | |
| MAexp100: | 59.51 | |
| Price / MA7: | +9.62% | |
| Price / MA20: | +4.64% | |
| Price / MA50: | +5.26% | |
| Price / MA100: | +6.36% | |
| Price / MAexp7: | +8.04% | |
| Price / MAexp20: | +6.49% | |
| Price / MAexp50: | +5.48% | |
| Price / MAexp100: | +4.54% |
News
The last news published on CVS HEALTH CORP. at the time of the generation of this analysis was as follows:
- CVS HEALTH CORPORATION REPORTS THIRD QUARTER 2024 RESULTS
- CVS Health Announces Leadership Appointments
- CVS Health Foundation helps address barriers to care for patients with chronic diseases in Atlanta
- CVS Health Appoints David Joyner President and Chief Executive Officer
- Aetna introduces SimplePay Health
About author
Online


Add a comment
Comments
0 comments on the analysis CVS HEALTH CORP. - Daily