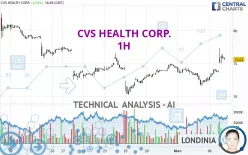
CVS HEALTH CORP. - 1H - Technical analysis published on 02/07/2024 (GMT)
- 269
- 0
Click here for a new analysis!
- Timeframe : 1H
- - Analysis generated on
- Status : LEVEL MAINTAINED

Summary of the analysis

Additional analysis
Quotes
The CVS HEALTH CORP. rating is 76.07 USD. The price has increased by +3.13% since the last closing and was traded between 75.06 USD and 77.40 USD over the period. The price is currently at +1.35% from its lowest and -1.72% from its highest.The Central Gaps scanner detects the formation of a bullish gap marking the strong presence of buyers against sellers at the opening. This formed a quotation gap.
Opening Gap UP
Type : Bullish
Timeframe : Openning
A study of price movements over other periods shows the following variations:
Near a new HIGH record (1 month)
Type : Bullish
Timeframe : Weekly
Technical
A technical analysis in 1H of this CVS HEALTH CORP. chart shows a bullish trend. 78.57% of the signals given by moving averages are bullish. The overall trend is reinforced by the strong bullish signals from short-term moving averages. An assessment of moving averages reveals a bullish signal that could impact this trend:
Moving Average bullish crossovers : AMA20 & AMA50
Type : Bullish
Timeframe : 1 hour
In fact, 16 technical indicators on 18 studied are currently positioned bullish. Caution: the Central Indicators scanner currently detects an excess:
RSI indicator is overbought : over 70
Type : Neutral
Timeframe : 1 hour
CCI indicator is overbought : over 100
Type : Neutral
Timeframe : 1 hour
Previous candle closed over Bollinger bands
Type : Neutral
Timeframe : 1 hour
Pivot points : price is over resistance 2
Type : Neutral
Timeframe : Weekly
Pivot points : price is over resistance 3
Type : Neutral
Timeframe : 1 hour
The Central Patterns scanner, which studies chart patterns, resistances and supports, has identified this signal:
Resistance of channel is broken
Type : Bullish
Timeframe : 1 hour
The Central Candlesticks scanner, specialised in Japanese candlesticks, did not identify any signals.
| S3 | S2 | S1 | Price | R1 | R2 | R3 | |
|---|---|---|---|---|---|---|---|
| ProTrendLines | 71.87 | 73.46 | 75.79 | 76.07 | 78.28 | 80.68 | 82.50 |
| Change (%) | -5.52% | -3.43% | -0.37% | - | +2.91% | +6.06% | +8.45% |
| Change | -4.20 | -2.61 | -0.28 | - | +2.21 | +4.61 | +6.43 |
| Level | Intermediate | Minor | Major | - | Intermediate | Major | Minor |
Pivot points can also be used to set your price objectives. Here is the price situation in relation to pivot points:
| Pivot points | S3 | S2 | S1 | PP | R1 | R2 | R3 |
|---|---|---|---|---|---|---|---|
| Standard | 71.01 | 71.73 | 72.74 | 73.46 | 74.47 | 75.19 | 76.20 |
| Camarilla | 73.28 | 73.44 | 73.60 | 73.76 | 73.92 | 74.08 | 74.24 |
| Woodie | 71.17 | 71.80 | 72.90 | 73.53 | 74.63 | 75.26 | 76.36 |
| Fibonacci | 71.73 | 72.39 | 72.80 | 73.46 | 74.12 | 74.53 | 75.19 |
| Pivot points | S3 | S2 | S1 | PP | R1 | R2 | R3 |
|---|---|---|---|---|---|---|---|
| Standard | 70.17 | 71.52 | 72.30 | 73.65 | 74.43 | 75.78 | 76.56 |
| Camarilla | 72.50 | 72.70 | 72.90 | 73.09 | 73.29 | 73.48 | 73.68 |
| Woodie | 69.90 | 71.38 | 72.03 | 73.51 | 74.16 | 75.64 | 76.29 |
| Fibonacci | 71.52 | 72.33 | 72.83 | 73.65 | 74.46 | 74.96 | 75.78 |
| Pivot points | S3 | S2 | S1 | PP | R1 | R2 | R3 |
|---|---|---|---|---|---|---|---|
| Standard | 56.56 | 63.38 | 68.87 | 75.69 | 81.18 | 88.00 | 93.49 |
| Camarilla | 70.99 | 72.11 | 73.24 | 74.37 | 75.50 | 76.63 | 77.76 |
| Woodie | 55.91 | 63.05 | 68.22 | 75.36 | 80.53 | 87.67 | 92.84 |
| Fibonacci | 63.38 | 68.08 | 70.98 | 75.69 | 80.39 | 83.29 | 88.00 |
Numerical data
The following is the status of technical indicators and moving averages registered at the time this technical analysis was created:
| RSI (14): | 73.43 | |
| MACD (12,26,9): | 0.5300 | |
| Directional Movement: | 32.35 | |
| AROON (14): | 85.71 | |
| DEMA (21): | 74.57 | |
| Parabolic SAR (0,02-0,02-0,2): | 73.81 | |
| Elder Ray (13): | 1.72 | |
| Super Trend (3,10): | 73.93 | |
| Zig ZAG (10): | 76.29 | |
| VORTEX (21): | 1.0500 | |
| Stochastique (14,3,5): | 76.69 | |
| TEMA (21): | 75.16 | |
| Williams %R (14): | -20.07 | |
| Chande Momentum Oscillator (20): | 4.02 | |
| Repulse (5,40,3): | 1.1100 | |
| ROCnROLL: | 1 | |
| TRIX (15,9): | 0.0200 | |
| Courbe Coppock: | 6.20 |
| MA7: | 73.95 | |
| MA20: | 74.57 | |
| MA50: | 74.64 | |
| MA100: | 71.89 | |
| MAexp7: | 75.02 | |
| MAexp20: | 74.05 | |
| MAexp50: | 73.78 | |
| MAexp100: | 74.14 | |
| Price / MA7: | +2.87% | |
| Price / MA20: | +2.01% | |
| Price / MA50: | +1.92% | |
| Price / MA100: | +5.81% | |
| Price / MAexp7: | +1.40% | |
| Price / MAexp20: | +2.73% | |
| Price / MAexp50: | +3.10% | |
| Price / MAexp100: | +2.60% |
News
Don't forget to follow the news on CVS HEALTH CORP.. At the time of publication of this analysis, the latest news was as follows:
- CVS HEALTH REPORTS FOURTH QUARTER AND FULL-YEAR 2023 RESULTS
- CVS Health adds two new renewable energy projects with Constellation
- New report from CVS Health® highlights opportunities for the future of community pharmacy
- CVS Health to Hold Fourth Quarter and Full Year 2023 Earnings Conference Call
- CVS Health announces leadership appointments
About author
Online


Add a comment
Comments
0 comments on the analysis CVS HEALTH CORP. - 1H