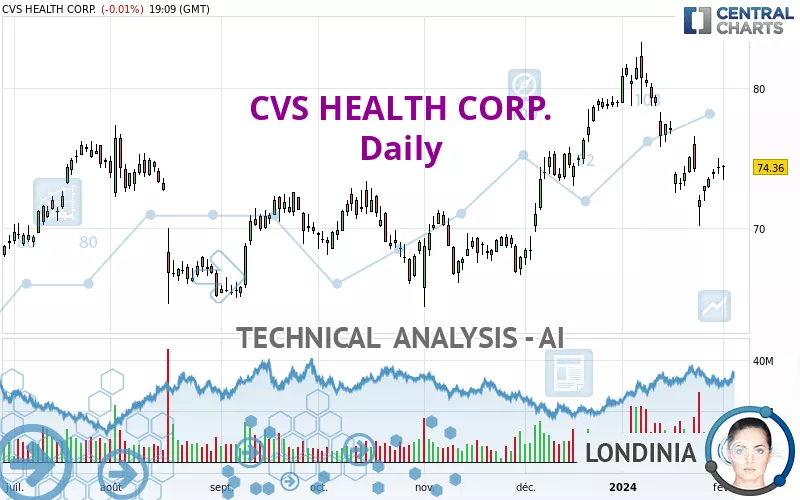
CVS HEALTH CORP. - Daily - Technical analysis published on 02/01/2024 (GMT)
- 176
- 0
Click here for a new analysis!
- Timeframe : Daily
- - Analysis generated on
- Status : TARGET REACHED
Summary of the analysis

Additional analysis
Quotes
The CVS HEALTH CORP. price is 74.36 USD. The price is lower by -0.01% since the last closing with the lowest point at 73.46 USD and the highest point at 74.51 USD. The deviation from the price is +1.23% for the low point and -0.20% for the high point.So that you have an overall view of the price change, here is a table showing the variations over several periods:
Near a new LOW record (1st january)
Type : Bearish
Timeframe : Weekly
Near a new LOW record (1 month)
Type : Bearish
Timeframe : Weekly
Technical
Technical analysis of CVS HEALTH CORP. in Daily shows an overall bullish trend. The signals given by moving averages are 64.29% bullish. This bullish trend could slow down given the neutral signals currently being given by short-term moving averages. An assessment of moving averages reveals a bullish signal that could impact this trend:
Bullish trend reversal : adaptative moving average 50
Type : Bullish
Timeframe : Daily
An assessment of technical indicators does not currently provide any relevant information on the direction of future price movements.
Central Indicators, the detector scanner for these technical indicators has recently detected several signals:
Price is back over the pivot point
Type : Bullish
Timeframe : Weekly
Price is back under the pivot point
Type : Bearish
Timeframe : Daily
Williams %R indicator is back over -50
Type : Bullish
Timeframe : Daily
Central Patterns, the scanner specializing in chart patterns, did not identify any signals.
The Central Candlesticks scanner, specialised in Japanese candlesticks, did not identify any signals.
| S3 | S2 | S1 | Price | R1 | R2 | R3 | |
|---|---|---|---|---|---|---|---|
| ProTrendLines | 68.43 | 70.84 | 74.19 | 74.36 | 75.79 | 78.28 | 80.68 |
| Change (%) | -7.97% | -4.73% | -0.23% | - | +1.92% | +5.27% | +8.50% |
| Change | -5.93 | -3.52 | -0.17 | - | +1.43 | +3.92 | +6.32 |
| Level | Minor | Major | Intermediate | - | Major | Intermediate | Major |
Pivot points can also be used to set your price objectives. Here is the price situation in relation to pivot points:
| Pivot points | S3 | S2 | S1 | PP | R1 | R2 | R3 |
|---|---|---|---|---|---|---|---|
| Standard | 72.64 | 73.24 | 73.80 | 74.40 | 74.96 | 75.56 | 76.12 |
| Camarilla | 74.05 | 74.16 | 74.26 | 74.37 | 74.48 | 74.58 | 74.69 |
| Woodie | 72.63 | 73.23 | 73.79 | 74.39 | 74.95 | 75.55 | 76.11 |
| Fibonacci | 73.24 | 73.68 | 73.95 | 74.40 | 74.84 | 75.11 | 75.56 |
| Pivot points | S3 | S2 | S1 | PP | R1 | R2 | R3 |
|---|---|---|---|---|---|---|---|
| Standard | 63.52 | 66.85 | 69.93 | 73.26 | 76.34 | 79.67 | 82.75 |
| Camarilla | 71.24 | 71.83 | 72.41 | 73.00 | 73.59 | 74.18 | 74.76 |
| Woodie | 63.39 | 66.79 | 69.80 | 73.20 | 76.21 | 79.61 | 82.62 |
| Fibonacci | 66.85 | 69.30 | 70.82 | 73.26 | 75.71 | 77.23 | 79.67 |
| Pivot points | S3 | S2 | S1 | PP | R1 | R2 | R3 |
|---|---|---|---|---|---|---|---|
| Standard | 56.56 | 63.38 | 68.87 | 75.69 | 81.18 | 88.00 | 93.49 |
| Camarilla | 70.99 | 72.11 | 73.24 | 74.37 | 75.50 | 76.63 | 77.76 |
| Woodie | 55.91 | 63.05 | 68.22 | 75.36 | 80.53 | 87.67 | 92.84 |
| Fibonacci | 63.38 | 68.08 | 70.98 | 75.69 | 80.39 | 83.29 | 88.00 |
Numerical data
The following are the details of the technical indicators and moving averages that were collected to generate this technical analysis:
| RSI (14): | 46.28 | |
| MACD (12,26,9): | -0.5300 | |
| Directional Movement: | -7.16 | |
| AROON (14): | -64.29 | |
| DEMA (21): | 74.46 | |
| Parabolic SAR (0,02-0,02-0,2): | 75.95 | |
| Elder Ray (13): | -0.50 | |
| Super Trend (3,10): | 77.30 | |
| Zig ZAG (10): | 74.13 | |
| VORTEX (21): | 0.9800 | |
| Stochastique (14,3,5): | 47.23 | |
| TEMA (21): | 73.10 | |
| Williams %R (14): | -46.50 | |
| Chande Momentum Oscillator (20): | -2.59 | |
| Repulse (5,40,3): | 0.4700 | |
| ROCnROLL: | -1 | |
| TRIX (15,9): | -0.0300 | |
| Courbe Coppock: | 12.17 |
| MA7: | 73.58 | |
| MA20: | 75.80 | |
| MA50: | 74.18 | |
| MA100: | 71.71 | |
| MAexp7: | 73.99 | |
| MAexp20: | 74.86 | |
| MAexp50: | 74.18 | |
| MAexp100: | 72.92 | |
| Price / MA7: | +1.06% | |
| Price / MA20: | -1.90% | |
| Price / MA50: | +0.24% | |
| Price / MA100: | +3.70% | |
| Price / MAexp7: | +0.50% | |
| Price / MAexp20: | -0.67% | |
| Price / MAexp50: | +0.24% | |
| Price / MAexp100: | +1.97% |
News
Don't forget to follow the news on CVS HEALTH CORP.. At the time of publication of this analysis, the latest news was as follows:
- CVS Health adds two new renewable energy projects with Constellation
- New report from CVS Health® highlights opportunities for the future of community pharmacy
- CVS Health to Hold Fourth Quarter and Full Year 2023 Earnings Conference Call
- CVS Health announces leadership appointments
- CVS Pharmacy® announces new simplified loyalty experience
About author
Online


Add a comment
Comments
0 comments on the analysis CVS HEALTH CORP. - Daily