NIELSEN N.V. - Daily - Technical analysis published on 12/10/2019 (GMT)
- 316
- 0
Click here for a new analysis!
- Timeframe : Daily
- - Analysis generated on
- Status : TARGET REACHED

Summary of the analysis
Additional analysis
Quotes
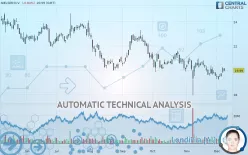
The NIELSEN N.V. rating is 19.99 USD. The price registered a decrease of -0.84% on the session with the lowest point at 19.91 USD and the highest point at 20.16 USD. The deviation from the price is +0.40% for the low point and -0.84% for the high point.The Central Gaps scanner detects a bearish opening marking the presence of sellers ahead of buyers at the opening but not sufficiently marked to allow the price to register a quotation gap.
Bearish opening
Type : Bearish
Timeframe : Openning
So that you have an overall view of the price change, here is a table showing the variations over several periods:
Technical
A technical analysis in Daily of this NIELSEN N.V. chart shows a sharp bearish trend. 82.14% of the signals given by moving averages are bearish. Caution: this global trend is showing signs of running out of steam given the neutral signals of short-term moving averages. The Central Indicators scanner detects bullish signals on moving averages that could impact this trend:
Bullish trend reversal : adaptative moving average 20
Type : Bullish
Timeframe : Daily
Bullish price crossover with Moving Average 20
Type : Bullish
Timeframe : Daily
In fact, 10 technical indicators on 18 studied are currently positioned bullish. But beware of excesses. The Central Indicators scanner currently detects this:
Williams %R indicator is overbought : over -20
Type : Neutral
Timeframe : Daily
RSI indicator is back over 50
Type : Bullish
Timeframe : Daily
MACD crosses UP its Moving Average
Type : Bullish
Timeframe : Daily
Price is back over the pivot point
Type : Bullish
Timeframe : Daily
Price is back over the pivot point
Type : Bullish
Timeframe : Weekly
Williams %R indicator is back over -50
Type : Bullish
Timeframe : Daily
No signals are given by Central Patterns, a market scanner specialised in chart patterns, resistances and supports.
For a small rebound in the very short term, the Central Candlesticks scanner currently notes the presence of this bullish pattern in Japanese candlesticks:
Upside gap
Type : Bullish
Timeframe : Daily
| Price | R1 | R2 | R3 | |
|---|---|---|---|---|
| ProTrendLines | 19.99 | 20.07 | 21.75 | 23.63 |
| Change (%) | - | +0.40% | +8.80% | +18.21% |
| Change | - | +0.08 | +1.76 | +3.64 |
| Level | - | Major | Major | Intermediate |
Attention could also be paid to pivot points to set price objectives:
| Pivot points | S3 | S2 | S1 | PP | R1 | R2 | R3 |
|---|---|---|---|---|---|---|---|
| Standard | 19.40 | 19.59 | 19.88 | 20.07 | 20.36 | 20.55 | 20.84 |
| Camarilla | 20.03 | 20.07 | 20.12 | 20.16 | 20.20 | 20.25 | 20.29 |
| Woodie | 19.44 | 19.62 | 19.92 | 20.10 | 20.40 | 20.58 | 20.88 |
| Fibonacci | 19.59 | 19.78 | 19.89 | 20.07 | 20.26 | 20.37 | 20.55 |
| Pivot points | S3 | S2 | S1 | PP | R1 | R2 | R3 |
|---|---|---|---|---|---|---|---|
| Standard | 18.41 | 18.81 | 19.48 | 19.88 | 20.55 | 20.95 | 21.62 |
| Camarilla | 19.87 | 19.96 | 20.06 | 20.16 | 20.26 | 20.36 | 20.45 |
| Woodie | 18.56 | 18.88 | 19.63 | 19.95 | 20.70 | 21.02 | 21.77 |
| Fibonacci | 18.81 | 19.22 | 19.47 | 19.88 | 20.29 | 20.54 | 20.95 |
| Pivot points | S3 | S2 | S1 | PP | R1 | R2 | R3 |
|---|---|---|---|---|---|---|---|
| Standard | 14.84 | 16.37 | 17.97 | 19.49 | 21.09 | 22.61 | 24.21 |
| Camarilla | 18.70 | 18.99 | 19.27 | 19.56 | 19.85 | 20.13 | 20.42 |
| Woodie | 14.88 | 16.39 | 18.00 | 19.51 | 21.12 | 22.63 | 24.24 |
| Fibonacci | 16.37 | 17.56 | 18.30 | 19.49 | 20.68 | 21.42 | 22.61 |
Numerical data
The following are the details of the technical indicators and moving averages that were collected to generate this technical analysis:
| RSI (14): | 48.45 | |
| MACD (12,26,9): | -0.2100 | |
| Directional Movement: | -1.92 | |
| AROON (14): | -71.43 | |
| DEMA (21): | 19.68 | |
| Parabolic SAR (0,02-0,02-0,2): | 19.33 | |
| Elder Ray (13): | 0.16 | |
| Super Trend (3,10): | 20.74 | |
| Zig ZAG (10): | 19.99 | |
| VORTEX (21): | 1.2100 | |
| Stochastique (14,3,5): | 53.99 | |
| TEMA (21): | 19.68 | |
| Williams %R (14): | -33.60 | |
| Chande Momentum Oscillator (20): | -0.06 | |
| Repulse (5,40,3): | 0.8400 | |
| ROCnROLL: | -1 | |
| TRIX (15,9): | -0.1800 | |
| Courbe Coppock: | 5.57 |
| MA7: | 19.70 | |
| MA20: | 20.01 | |
| MA50: | 20.38 | |
| MA100: | 21.01 | |
| MAexp7: | 19.83 | |
| MAexp20: | 19.97 | |
| MAexp50: | 20.40 | |
| MAexp100: | 21.01 | |
| Price / MA7: | +1.47% | |
| Price / MA20: | -0.10% | |
| Price / MA50: | -1.91% | |
| Price / MA100: | -4.85% | |
| Price / MAexp7: | +0.81% | |
| Price / MAexp20: | +0.10% | |
| Price / MAexp50: | -2.01% | |
| Price / MAexp100: | -4.85% |
News
The last news published on NIELSEN N.V. at the time of the generation of this analysis was as follows:
- Investor Network: Nielsen Holdings PLC to Host Earnings Call
-
 Nielsen To Regard Hulu, YouTube Viewers
- Hulu And YouTube TV Now Included In TV Ratings Announces Nielsen
- Nielsen and JD.com Collaborate on Multi-Touch Attribution Solution for Marketers
- Video On Demand (VOD) Content Ratings Added To Media Impact Planning Solution By Nielsen
About author

Online


Add a comment
Comments
0 comments on the analysis NIELSEN N.V. - Daily