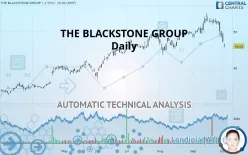
BLACKSTONE INC. - Daily - Technical analysis published on 10/02/2019 (GMT)
- 425
- 0
- Who voted?
Click here for a new analysis!
- Timeframe : Daily
- - Analysis generated on
- Status : INVALID

Summary of the analysis

Additional analysis
Quotes
The THE BLACKSTONE GROUP price is 46.01 USD. The price is lower by -2.54% since the last closing and was traded between 45.62 USD and 46.77 USD over the period. The price is currently at +0.85% from its lowest and -1.62% from its highest.The Central Gaps scanner detects the formation of a bearish gap marking the strong presence of sellers ahead of buyers at the opening. This formed a quotation gap.
Opening Gap DOWN
Type : Bearish
Timeframe : Openning
A study of price movements over other periods shows the following variations:
Technical
Technical analysis of THE BLACKSTONE GROUP in Daily shows an overall slightly bearish trend. 60.71% of the signals given by moving averages are bearish. This slightly bearish trend could be reinforced by the strong bearish signals given by short-term moving averages. The Central Indicators scanner detects a bearish signal on moving averages that could impact this trend:
Bearish trend reversal : Moving Average 50
Type : Bearish
Timeframe : Daily
In fact, according to the parameters integrated into the Central Analyzer system, 14 technical indicators out of 18 analysed are currently bearish. But beware of excesses. The Central Indicators scanner currently detects this:
CCI indicator is oversold : under -100
Type : Neutral
Timeframe : Daily
Williams %R indicator is oversold : under -80
Type : Neutral
Timeframe : Daily
Pivot points : price is under support 3
Type : Neutral
Timeframe : Weekly
Price is back under the pivot point
Type : Bearish
Timeframe : Daily
The Central Patterns scanner, which studies chart patterns, resistances and supports, has identified these signals:
Near horizontal support
Type : Bullish
Timeframe : Daily
Support of channel is broken
Type : Bearish
Timeframe : Daily
The Central Candlesticks scanner which studies Japanese candlesticks did not detect anything.
| S3 | S2 | S1 | Price | R1 | R2 | |
|---|---|---|---|---|---|---|
| ProTrendLines | 39.69 | 41.80 | 43.96 | 46.01 | 49.72 | 53.55 |
| Change (%) | -13.74% | -9.15% | -4.46% | - | +8.06% | +16.39% |
| Change | -6.32 | -4.21 | -2.05 | - | +3.71 | +7.54 |
| Level | Major | Minor | Major | - | Major | Intermediate |
Attention could also be paid to pivot points to set price objectives:
| Pivot points | S3 | S2 | S1 | PP | R1 | R2 | R3 |
|---|---|---|---|---|---|---|---|
| Standard | 43.56 | 45.27 | 46.24 | 47.95 | 48.92 | 50.63 | 51.60 |
| Camarilla | 46.47 | 46.72 | 46.96 | 47.21 | 47.46 | 47.70 | 47.95 |
| Woodie | 43.19 | 45.08 | 45.87 | 47.77 | 48.55 | 50.45 | 51.23 |
| Fibonacci | 45.27 | 46.29 | 46.93 | 47.95 | 48.98 | 49.61 | 50.63 |
| Pivot points | S3 | S2 | S1 | PP | R1 | R2 | R3 |
|---|---|---|---|---|---|---|---|
| Standard | 44.33 | 46.87 | 48.55 | 51.09 | 52.77 | 55.31 | 56.99 |
| Camarilla | 49.06 | 49.45 | 49.83 | 50.22 | 50.61 | 50.99 | 51.38 |
| Woodie | 43.89 | 46.65 | 48.11 | 50.87 | 52.33 | 55.09 | 56.55 |
| Fibonacci | 46.87 | 48.48 | 49.48 | 51.09 | 52.70 | 53.70 | 55.31 |
| Pivot points | S3 | S2 | S1 | PP | R1 | R2 | R3 |
|---|---|---|---|---|---|---|---|
| Standard | 39.58 | 43.96 | 46.40 | 50.79 | 53.23 | 57.61 | 60.05 |
| Camarilla | 46.96 | 47.59 | 48.21 | 48.84 | 49.47 | 50.09 | 50.72 |
| Woodie | 38.60 | 43.47 | 45.43 | 50.30 | 52.25 | 57.12 | 59.08 |
| Fibonacci | 43.96 | 46.57 | 48.18 | 50.79 | 53.39 | 55.00 | 57.61 |
Numerical data
The following is the status of technical indicators and moving averages registered at the time this technical analysis was created:
| RSI (14): | 30.21 | |
| MACD (12,26,9): | -0.1600 | |
| Directional Movement: | -20.77 | |
| AROON (14): | -85.71 | |
| DEMA (21): | 50.69 | |
| Parabolic SAR (0,02-0,02-0,2): | 54.32 | |
| Elder Ray (13): | -4.08 | |
| Super Trend (3,10): | 51.17 | |
| Zig ZAG (10): | 46.15 | |
| VORTEX (21): | 0.9000 | |
| Stochastique (14,3,5): | 5.62 | |
| TEMA (21): | 49.62 | |
| Williams %R (14): | -92.41 | |
| Chande Momentum Oscillator (20): | -7.14 | |
| Repulse (5,40,3): | -6.2700 | |
| ROCnROLL: | 2 | |
| TRIX (15,9): | 0.2300 | |
| Courbe Coppock: | 5.32 |
| MA7: | 50.13 | |
| MA20: | 51.35 | |
| MA50: | 49.39 | |
| MA100: | 46.16 | |
| MAexp7: | 49.29 | |
| MAexp20: | 50.48 | |
| MAexp50: | 49.19 | |
| MAexp100: | 46.33 | |
| Price / MA7: | -8.22% | |
| Price / MA20: | -10.40% | |
| Price / MA50: | -6.84% | |
| Price / MA100: | -0.32% | |
| Price / MAexp7: | -6.65% | |
| Price / MAexp20: | -8.85% | |
| Price / MAexp50: | -6.46% | |
| Price / MAexp100: | -0.69% |
News
The latest news and videos published on THE BLACKSTONE GROUP at the time of the analysis were as follows:
- Blackstone Announces Third Quarter 2019 Investor Call
- Blackstone to Acquire 65% Controlling Interest in Great Wolf Resorts and Form New $2.9 Billion Joint Venture With Centerbridge Partners
- Blackstone Closes Acquisition of Vungle, a Leading Mobile Performance Marketing Platform
- Blackstone Closes Acquisition of Vungle, a Leading Mobile Performance Marketing Platform
- Blackstone Closes Acquisition of Vungle, a Leading Mobile Performance Marketing Platform
About author

Online


Add a comment
Comments
0 comments on the analysis BLACKSTONE INC. - Daily