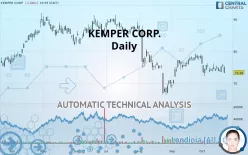
KEMPER CORP. - Daily - Technical analysis published on 10/23/2019 (GMT)
- 195
- 0
- Who voted?
Click here for a new analysis!
- Timeframe : Daily
- - Analysis generated on
- Status : LEVEL MAINTAINED

Summary of the analysis

Additional analysis
Quotes
The KEMPER CORP. rating is 73.38 USD. On the day, this instrument lost -2.68% and was between 73.16 USD and 75.19 USD. This implies that the price is at +0.30% from its lowest and at -2.41% from its highest.A bearish opening was detected by the Central Gaps scanner. Sellers are trying to impose a bearish trend in the very short term.
Bearish opening
Type : Bearish
Timeframe : Openning
So that you have an overall view of the price change, here is a table showing the variations over several periods:
Near a new LOW record (1 month)
Type : Bearish
Timeframe : Weekly
Technical
Technical analysis of this Daily chart of KEMPER CORP. indicates that the overall trend is strongly bearish. 89.29% of the signals given by moving averages are bearish. This strongly bearish trend is supported by the strong bearish signals given by short-term moving averages. There is no crossing of moving average by the price or crossing of moving averages between themselves.
On the 18 technical indicators analysed, 4 are bullish, 4 are neutral and 10 are bearish. Central Indicators, the detector scanner for these technical indicators has recently detected several signals:
Pivot points : price is under support 1
Type : Neutral
Timeframe : Weekly
Pivot points : price is under support 3
Type : Neutral
Timeframe : Daily
RSI indicator is back over 50
Type : Bullish
Timeframe : Daily
MACD crosses UP its Moving Average
Type : Bullish
Timeframe : Daily
Parabolic SAR indicator bullish reversal
Type : Bullish
Timeframe : Daily
Price is back over the pivot point
Type : Bullish
Timeframe : Weekly
Williams %R indicator is back over -50
Type : Bullish
Timeframe : Daily
No signals are given by Central Patterns, a market scanner specialised in chart patterns, resistances and supports.
No result was found by the Central Candlesticks scanner on Japanese candlesticks.
| S3 | S2 | S1 | Price | R1 | R2 | R3 | |
|---|---|---|---|---|---|---|---|
| ProTrendLines | 62.40 | 66.89 | 70.71 | 73.38 | 75.59 | 78.85 | 84.90 |
| Change (%) | -14.96% | -8.84% | -3.64% | - | +3.01% | +7.45% | +15.70% |
| Change | -10.98 | -6.49 | -2.67 | - | +2.21 | +5.47 | +11.52 |
| Level | Minor | Intermediate | Major | - | Minor | Major | Intermediate |
To determine price objectives, it is also possible to use the pivot points. Here is the price position in relation to pivot points:
| Pivot points | S3 | S2 | S1 | PP | R1 | R2 | R3 |
|---|---|---|---|---|---|---|---|
| Standard | 73.75 | 74.31 | 74.85 | 75.41 | 75.95 | 76.51 | 77.05 |
| Camarilla | 75.10 | 75.20 | 75.30 | 75.40 | 75.50 | 75.60 | 75.70 |
| Woodie | 73.75 | 74.31 | 74.85 | 75.41 | 75.95 | 76.51 | 77.05 |
| Fibonacci | 74.31 | 74.73 | 74.99 | 75.41 | 75.83 | 76.09 | 76.51 |
| Pivot points | S3 | S2 | S1 | PP | R1 | R2 | R3 |
|---|---|---|---|---|---|---|---|
| Standard | 71.94 | 72.75 | 73.95 | 74.76 | 75.96 | 76.77 | 77.97 |
| Camarilla | 74.61 | 74.79 | 74.98 | 75.16 | 75.34 | 75.53 | 75.71 |
| Woodie | 72.15 | 72.85 | 74.16 | 74.86 | 76.17 | 76.87 | 78.18 |
| Fibonacci | 72.75 | 73.51 | 73.99 | 74.76 | 75.52 | 76.00 | 76.77 |
| Pivot points | S3 | S2 | S1 | PP | R1 | R2 | R3 |
|---|---|---|---|---|---|---|---|
| Standard | 60.39 | 64.46 | 71.20 | 75.27 | 82.01 | 86.08 | 92.82 |
| Camarilla | 74.98 | 75.97 | 76.96 | 77.95 | 78.94 | 79.93 | 80.92 |
| Woodie | 61.74 | 65.13 | 72.55 | 75.94 | 83.36 | 86.75 | 94.17 |
| Fibonacci | 64.46 | 68.59 | 71.14 | 75.27 | 79.40 | 81.95 | 86.08 |
Numerical data
The following are the details of the technical indicators and moving averages that were collected to generate this technical analysis:
| RSI (14): | 42.38 | |
| MACD (12,26,9): | -0.4700 | |
| Directional Movement: | -3.07 | |
| AROON (14): | 14.29 | |
| DEMA (21): | 74.32 | |
| Parabolic SAR (0,02-0,02-0,2): | 72.34 | |
| Elder Ray (13): | -0.50 | |
| Super Trend (3,10): | 73.29 | |
| Zig ZAG (10): | 73.38 | |
| VORTEX (21): | 0.8500 | |
| Stochastique (14,3,5): | 50.29 | |
| TEMA (21): | 74.36 | |
| Williams %R (14): | -72.32 | |
| Chande Momentum Oscillator (20): | -2.27 | |
| Repulse (5,40,3): | -2.4000 | |
| ROCnROLL: | 2 | |
| TRIX (15,9): | -0.0600 | |
| Courbe Coppock: | 5.05 |
| MA7: | 74.47 | |
| MA20: | 75.26 | |
| MA50: | 74.59 | |
| MA100: | 80.18 | |
| MAexp7: | 74.43 | |
| MAexp20: | 74.91 | |
| MAexp50: | 76.20 | |
| MAexp100: | 78.06 | |
| Price / MA7: | -1.46% | |
| Price / MA20: | -2.50% | |
| Price / MA50: | -1.62% | |
| Price / MA100: | -8.48% | |
| Price / MAexp7: | -1.41% | |
| Price / MAexp20: | -2.04% | |
| Price / MAexp50: | -3.70% | |
| Price / MAexp100: | -6.00% |
News
The latest news and videos published on KEMPER CORP. at the time of the analysis were as follows:
-
 Ellie Kemper Expecting Baby #2!
- Kemper Reports Strong Fourth Quarter and Full Year 2018 Operating Results
- Kemper Announces Dividend Increase
- Kemper Announces Retirement of Director Douglas Geoga
- Kyle Kemper Joins Alternate Health's Board of Directors
About author

Online


Add a comment
Comments
0 comments on the analysis KEMPER CORP. - Daily