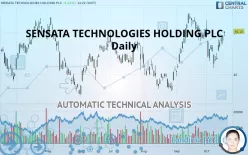
SENSATA TECHNOLOGIES HOLDING PLC - Daily - Technical analysis published on 10/17/2019 (GMT)
- 312
- 0
- Who voted?
Click here for a new analysis!
- Timeframe : Daily
- - Analysis generated on
- Status : TARGET REACHED

Summary of the analysis

Additional analysis
Quotes
The SENSATA TECHNOLOGIES HOLDING PLC rating is 50.15 USD. The price registered an increase of +1.21% on the session and was traded between 49.60 USD and 50.15 USD over the period. The price is currently at +1.11% from its lowest and 0% from its highest.A bullish gap was detected at the opening by the Central Gaps scanner. There are a lot of buyers and they have the upper hand in the very short term.
Opening Gap UP
Type : Bullish
Timeframe : Openning
So that you have an overall view of the price change, here is a table showing the variations over several periods:
Near a new HIGH record (1 year)
Type : Bullish
Timeframe : Weekly
Near a new HIGH record (1st january)
Type : Bullish
Timeframe : Weekly
Near a new HIGH record (1 month)
Type : Bullish
Timeframe : Weekly
Technical
A technical analysis in Daily of this SENSATA TECHNOLOGIES HOLDING PLC chart shows a strongly bullish trend. 89.29% of the signals given by moving averages are bullish. The slightly bullish signals given by the short-term moving averages indicate this trend is showing signs of running out of steam. An assessment of moving averages reveals a bullish signal that could impact this trend:
Bullish price crossover with adaptative moving average 20
Type : Bullish
Timeframe : Daily
Technical indicators are strongly bullish, suggesting that the price increase should continue.
But beware of excesses. The Central Indicators scanner currently detects this:
Williams %R indicator is overbought : over -20
Type : Neutral
Timeframe : Daily
MACD indicator is back over 0
Type : Bullish
Timeframe : Daily
Price is back over the pivot point
Type : Bullish
Timeframe : Daily
The Central Patterns scanner, which studies chart patterns, resistances and supports, has identified this signal:
Horizontal resistance is broken
Type : Bullish
Timeframe : Daily
No result was found by the Central Candlesticks scanner on Japanese candlesticks.
| S3 | S2 | S1 | Price | R1 | R2 | R3 | |
|---|---|---|---|---|---|---|---|
| ProTrendLines | 47.58 | 49.00 | 50.02 | 50.15 | 51.79 | 54.39 | 58.66 |
| Change (%) | -5.12% | -2.29% | -0.26% | - | +3.27% | +8.45% | +16.97% |
| Change | -2.57 | -1.15 | -0.13 | - | +1.64 | +4.24 | +8.51 |
| Level | Major | Major | Intermediate | - | Major | Minor | Major |
Pivot points can also be used to set your price objectives. Here is the price situation in relation to pivot points:
| Pivot points | S3 | S2 | S1 | PP | R1 | R2 | R3 |
|---|---|---|---|---|---|---|---|
| Standard | 47.73 | 48.15 | 48.85 | 49.27 | 49.97 | 50.39 | 51.09 |
| Camarilla | 49.24 | 49.35 | 49.45 | 49.55 | 49.65 | 49.76 | 49.86 |
| Woodie | 47.87 | 48.22 | 48.99 | 49.34 | 50.11 | 50.46 | 51.23 |
| Fibonacci | 48.15 | 48.58 | 48.84 | 49.27 | 49.70 | 49.96 | 50.39 |
| Pivot points | S3 | S2 | S1 | PP | R1 | R2 | R3 |
|---|---|---|---|---|---|---|---|
| Standard | 42.97 | 44.36 | 46.43 | 47.82 | 49.89 | 51.28 | 53.35 |
| Camarilla | 47.56 | 47.88 | 48.19 | 48.51 | 48.83 | 49.14 | 49.46 |
| Woodie | 43.32 | 44.53 | 46.78 | 47.99 | 50.24 | 51.45 | 53.70 |
| Fibonacci | 44.36 | 45.68 | 46.50 | 47.82 | 49.14 | 49.96 | 51.28 |
| Pivot points | S3 | S2 | S1 | PP | R1 | R2 | R3 |
|---|---|---|---|---|---|---|---|
| Standard | 38.19 | 41.48 | 45.77 | 49.05 | 53.34 | 56.62 | 60.92 |
| Camarilla | 47.98 | 48.67 | 49.37 | 50.06 | 50.75 | 51.45 | 52.14 |
| Woodie | 38.70 | 41.73 | 46.27 | 49.30 | 53.85 | 56.88 | 61.42 |
| Fibonacci | 41.48 | 44.37 | 46.16 | 49.05 | 51.94 | 53.73 | 56.62 |
Numerical data
The following are the details of the technical indicators and moving averages that were collected to generate this technical analysis:
| RSI (14): | 57.83 | |
| MACD (12,26,9): | 0.1600 | |
| Directional Movement: | 3.77 | |
| AROON (14): | -35.71 | |
| DEMA (21): | 48.97 | |
| Parabolic SAR (0,02-0,02-0,2): | 45.90 | |
| Elder Ray (13): | 1.04 | |
| Super Trend (3,10): | 50.26 | |
| Zig ZAG (10): | 50.02 | |
| VORTEX (21): | 0.9300 | |
| Stochastique (14,3,5): | 68.42 | |
| TEMA (21): | 48.77 | |
| Williams %R (14): | -22.63 | |
| Chande Momentum Oscillator (20): | 0.05 | |
| Repulse (5,40,3): | 0.9700 | |
| ROCnROLL: | 1 | |
| TRIX (15,9): | 0.0300 | |
| Courbe Coppock: | 4.30 |
| MA7: | 48.51 | |
| MA20: | 48.83 | |
| MA50: | 47.56 | |
| MA100: | 47.19 | |
| MAexp7: | 48.91 | |
| MAexp20: | 48.69 | |
| MAexp50: | 48.16 | |
| MAexp100: | 47.68 | |
| Price / MA7: | +3.38% | |
| Price / MA20: | +2.70% | |
| Price / MA50: | +5.45% | |
| Price / MA100: | +6.27% | |
| Price / MAexp7: | +2.54% | |
| Price / MAexp20: | +3.00% | |
| Price / MAexp50: | +4.13% | |
| Price / MAexp100: | +5.18% |
News
The latest news and videos published on SENSATA TECHNOLOGIES HOLDING PLC at the time of the analysis were as follows:
- Sensata Technologies Holding NV to Host Earnings Call
- Sensata Technologies Holding NV to Host Earnings Call
- Sensata Showcases Leading Edge Technologies at Frankfurt Auto Show (IAA)
- Investor Network: Sensata Technologies Holding NV to Host Earnings Call
- Sensata Technologies Reports Fourth Quarter and Full Year 2016 Financial Results
About author

Online


Add a comment
Comments
0 comments on the analysis SENSATA TECHNOLOGIES HOLDING PLC - Daily