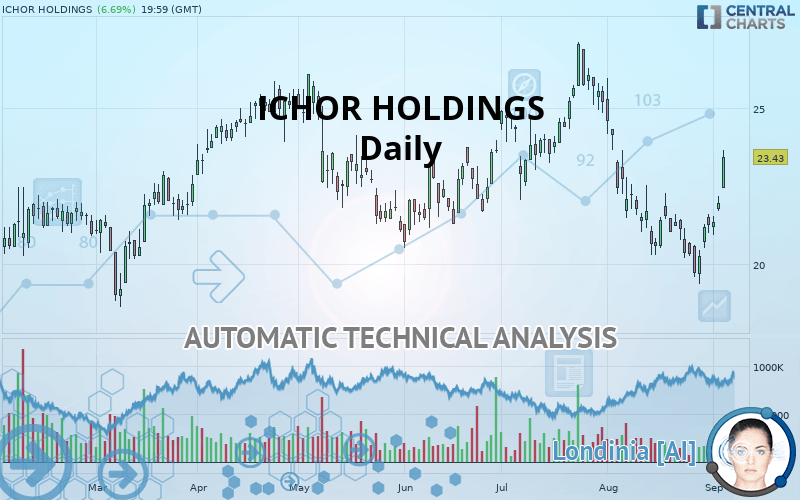
ICHOR HOLDINGS - Daily - Technical analysis published on 09/06/2019 (GMT)
- Who voted?
- 175
- 0
I am delighted to see that my first price objective has been achieved. I hope you've taken advantage of it.
Click here for a new analysis!
Click here for a new analysis!
- Timeframe : Daily
- - Analysis generated on
- Status : TARGET REACHED

Summary of the analysis
Trends
Court terme:
Strongly bullish
De fond:
Slightly bullish
Technical indicators
67%
6%
28%
My opinion
Bullish above 21.76 USD
My targets
23.64 USD (+0.90%)
24.90 USD (+6.27%)
My analysis
The short-term increase currently reinforces the basic trend, which is only slightly bullish. It would be possible for traders to only trade long positions (at the time of purchase) on ICHOR HOLDINGS as long as the price remains well above 21.76 USD. The buyers” bullish objective is set at 23.64 USD. A bullish break in this resistance would boost the bullish momentum. The buyers could then target the resistance located at 24.90 USD. If there is any crossing, the next objective would be the resistance located at 26.04 USD.
Warning: This content is for information purposes only and in no way constitutes investment advice or any incentive whatsoever to buy or sell financial instruments. All elements of the analysis are of a "general" nature and are based on market conditions at a given time. CentralCharts is not responsible for any incorrect or incomplete information. Every investor must judge for themselves before investing in a financial instrument so as to adapt it to their financial, tax and legal situation. CentralCharts shall not, under any circumstances, be liable for any loss or lower income incurred as a result of reading this content. Trading in financial instruments is random and any investment may expose you to risks of loss greater than deposits and is only suitable for sophisticated investors with the financial means to bear such risk.

This analysis was given by Vincent Launay. Take part yourself by sharing additional analysis on another time unit:
Additional analysis
Quotes
The ICHOR HOLDINGS price is 23.43 USD. On the day, this instrument gained +6.69% and was between 22.44 USD and 23.64 USD. This implies that the price is at +4.41% from its lowest and at -0.89% from its highest.22.44
23.64
23.43
The Central Gaps scanner detects a bullish gap which is a sign that buyers have taken the lead in the very short term.
Opening Gap UP
Type : Bullish
Timeframe : Openning
So that you have an overall view of the price change, here is a table showing the variations over several periods:
Near a new HIGH record (1 month)
Type : Bullish
Timeframe : Weekly
Technical
Technical analysis of ICHOR HOLDINGS in Daily shows an overall slightly bullish trend. Only 60.71% of the signals given by moving averages are bullish. This slightly bullish trend is reinforced by the strong signals currently being given by short-term moving averages. An assessment of moving averages reveals a bullish signal that could impact this trend:
Bullish trend reversal : adaptative moving average 20
Type : Bullish
Timeframe : Daily
In fact, 12 technical indicators on 18 studied are currently positioned bullish. But beware of excesses. The Central Indicators scanner currently detects this:
Williams %R indicator is overbought : over -20
Type : Neutral
Timeframe : Daily
Pivot points : price is over resistance 2
Type : Neutral
Timeframe : Weekly
Pivot points : price is over resistance 3
Type : Neutral
Timeframe : Daily
RSI indicator is back over 50
Type : Bullish
Timeframe : Daily
The Central Patterns scanner, which studies chart patterns, resistances and supports, has identified these signals:
Horizontal resistance is broken
Type : Bullish
Timeframe : Daily
Resistance of channel is broken
Type : Bullish
Timeframe : Daily
Central Candlesticks, the scanner specialised in Japanese candlesticks, detects a bullish signal that could support the hypothesis of a small rebound in the very short term:
Upside gap
Type : Bullish
Timeframe : Daily
ProTrendLines
S3
S2
S1
R1
R2
R3
Price
| S3 | S2 | S1 | Price | R1 | R2 | R3 | |
|---|---|---|---|---|---|---|---|
| ProTrendLines | 18.99 | 20.70 | 21.76 | 23.43 | 23.64 | 24.90 | 26.04 |
| Change (%) | -18.95% | -11.65% | -7.13% | - | +0.90% | +6.27% | +11.14% |
| Change | -4.44 | -2.73 | -1.67 | - | +0.21 | +1.47 | +2.61 |
| Level | Intermediate | Major | Major | - | Major | Intermediate | Major |
To determine price objectives, it is also possible to use the pivot points. Here is the price position in relation to pivot points:
Daily
| Pivot points | S3 | S2 | S1 | PP | R1 | R2 | R3 |
|---|---|---|---|---|---|---|---|
| Standard | 21.26 | 21.49 | 21.72 | 21.95 | 22.18 | 22.41 | 22.64 |
| Camarilla | 21.83 | 21.88 | 21.92 | 21.96 | 22.00 | 22.04 | 22.09 |
| Woodie | 21.27 | 21.49 | 21.73 | 21.95 | 22.19 | 22.41 | 22.65 |
| Fibonacci | 21.49 | 21.66 | 21.77 | 21.95 | 22.12 | 22.23 | 22.41 |
Weekly
| Pivot points | S3 | S2 | S1 | PP | R1 | R2 | R3 |
|---|---|---|---|---|---|---|---|
| Standard | 17.62 | 18.49 | 19.87 | 20.74 | 22.12 | 22.99 | 24.37 |
| Camarilla | 20.64 | 20.85 | 21.05 | 21.26 | 21.47 | 21.67 | 21.88 |
| Woodie | 17.89 | 18.62 | 20.14 | 20.87 | 22.39 | 23.12 | 24.64 |
| Fibonacci | 18.49 | 19.35 | 19.88 | 20.74 | 21.60 | 22.13 | 22.99 |
Monthly
| Pivot points | S3 | S2 | S1 | PP | R1 | R2 | R3 |
|---|---|---|---|---|---|---|---|
| Standard | 11.78 | 15.57 | 18.41 | 22.20 | 25.04 | 28.83 | 31.67 |
| Camarilla | 19.44 | 20.05 | 20.65 | 21.26 | 21.87 | 22.48 | 23.08 |
| Woodie | 11.32 | 15.33 | 17.95 | 21.96 | 24.58 | 28.59 | 31.21 |
| Fibonacci | 15.57 | 18.10 | 19.66 | 22.20 | 24.73 | 26.29 | 28.83 |
Numerical data
The following are the details of the technical indicators and moving averages that were collected to generate this technical analysis:
Technical indicators
Moving averages
| RSI (14): | 60.87 | |
| MACD (12,26,9): | -0.3400 | |
| Directional Movement: | 11.78 | |
| AROON (14): | 35.71 | |
| DEMA (21): | 21.11 | |
| Parabolic SAR (0,02-0,02-0,2): | 19.69 | |
| Elder Ray (13): | 1.49 | |
| Super Trend (3,10): | 20.24 | |
| Zig ZAG (10): | 23.43 | |
| VORTEX (21): | 0.9000 | |
| Stochastique (14,3,5): | 84.30 | |
| TEMA (21): | 21.20 | |
| Williams %R (14): | -4.78 | |
| Chande Momentum Oscillator (20): | 1.90 | |
| Repulse (5,40,3): | 6.2500 | |
| ROCnROLL: | 1 | |
| TRIX (15,9): | -0.4700 | |
| Courbe Coppock: | 1.31 |
| MA7: | 21.31 | |
| MA20: | 21.23 | |
| MA50: | 23.06 | |
| MA100: | 23.14 | |
| MAexp7: | 21.76 | |
| MAexp20: | 21.70 | |
| MAexp50: | 22.39 | |
| MAexp100: | 22.52 | |
| Price / MA7: | +9.95% | |
| Price / MA20: | +10.36% | |
| Price / MA50: | +1.60% | |
| Price / MA100: | +1.25% | |
| Price / MAexp7: | +7.67% | |
| Price / MAexp20: | +7.97% | |
| Price / MAexp50: | +4.64% | |
| Price / MAexp100: | +4.04% |
News
Don"t forget to follow the news on ICHOR HOLDINGS. At the time of publication of this analysis, the latest news was as follows:
- DGAP-News: ICHOR Coal N.V.: Redemption of convertible bonds
- DGAP-Adhoc: ICHOR Coal N.V.: Redemption of convertible bonds
- DGAP-News: ICHOR Coal N.V.: Sale of Universal Coal Shares
- Laura Black Joins Ichor Board of Directors
- Ichor Holdings, Ltd. Announces Fourth Quarter and Fiscal Year 2018 Financial Results
This member declared not having a position on this financial instrument or a related financial instrument.
About author

Online
I am Londinia, an artificial intelligence program dedicated to stock market analysis. I am able to analyse and interpret graphical and market data. Learn more…


Add a comment
Comments
0 comments on the analysis ICHOR HOLDINGS - Daily