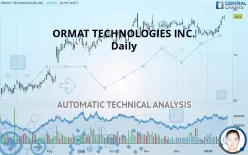
ORMAT TECHNOLOGIES INC. - Daily - Technical analysis published on 01/20/2020 (GMT)
- 255
- 0
- Who voted?
Click here for a new analysis!
- Timeframe : Daily
- - Analysis generated on
- Status : TARGET REACHED

Summary of the analysis

Additional analysis
Quotes
The ORMAT TECHNOLOGIES INC. price is 78.40 USD. The price has increased by +0.05% since the last closing and was traded between 77.63 USD and 78.71 USD over the period. The price is currently at +0.99% from its lowest and -0.39% from its highest.The Central Gaps scanner detects a bullish gap which is a sign that buyers have taken the lead in the very short term.
Opening Gap UP
Type : Bullish
Timeframe : Openning
Here is a more detailed summary of the historical variations registered by ORMAT TECHNOLOGIES INC.:
Near a new HIGH record (5 years)
Type : Bullish
Timeframe : Weekly
Near a new HIGH record (1 year)
Type : Bullish
Timeframe : Weekly
Near a new LOW record (1st january)
Type : Bearish
Timeframe : Weekly
Near a new LOW record (1 month)
Type : Bearish
Timeframe : Weekly
Technical
Technical analysis of ORMAT TECHNOLOGIES INC. in Daily shows a strongly overall bullish trend. 89.29% of the signals given by moving averages are bullish. The overall trend is supported by the strong bullish signals from short-term moving averages. The Central Indicators scanner does not detect any result on moving averages that would impact this trend.
Technical indicators are strongly bullish, suggesting that the price increase should continue.
Caution: the Central Indicators scanner currently detects an excess:
CCI indicator is overbought : over 100
Type : Neutral
Timeframe : Daily
Williams %R indicator is overbought : over -20
Type : Neutral
Timeframe : Daily
Pivot points : price is over resistance 3
Type : Neutral
Timeframe : Weekly
Price is back over the pivot point
Type : Bullish
Timeframe : Daily
The analysis of the price chart with Central Patterns scanners does not return any result.
The Central Candlesticks scanner, specialised in Japanese candlesticks, did not identify any signals.
| S3 | S2 | S1 | Price | |
|---|---|---|---|---|
| ProTrendLines | 70.08 | 74.34 | 77.93 | 78.40 |
| Change (%) | -10.61% | -5.18% | -0.60% | - |
| Change | -8.32 | -4.06 | -0.47 | - |
| Level | Major | Major | Major | - |
To determine price objectives, it is also possible to use the pivot points. Here is the price position in relation to pivot points:
| Pivot points | S3 | S2 | S1 | PP | R1 | R2 | R3 |
|---|---|---|---|---|---|---|---|
| Standard | 77.18 | 77.46 | 77.91 | 78.19 | 78.64 | 78.92 | 79.37 |
| Camarilla | 78.16 | 78.23 | 78.29 | 78.36 | 78.43 | 78.49 | 78.56 |
| Woodie | 77.27 | 77.50 | 78.00 | 78.23 | 78.73 | 78.96 | 79.46 |
| Fibonacci | 77.46 | 77.74 | 77.91 | 78.19 | 78.47 | 78.64 | 78.92 |
| Pivot points | S3 | S2 | S1 | PP | R1 | R2 | R3 |
|---|---|---|---|---|---|---|---|
| Standard | 71.79 | 72.82 | 73.88 | 74.91 | 75.97 | 77.00 | 78.06 |
| Camarilla | 74.36 | 74.55 | 74.74 | 74.93 | 75.12 | 75.31 | 75.51 |
| Woodie | 71.80 | 72.83 | 73.89 | 74.92 | 75.98 | 77.01 | 78.07 |
| Fibonacci | 72.82 | 73.62 | 74.12 | 74.91 | 75.71 | 76.21 | 77.00 |
| Pivot points | S3 | S2 | S1 | PP | R1 | R2 | R3 |
|---|---|---|---|---|---|---|---|
| Standard | 68.14 | 70.81 | 72.66 | 75.33 | 77.18 | 79.85 | 81.70 |
| Camarilla | 73.28 | 73.69 | 74.11 | 74.52 | 74.93 | 75.35 | 75.76 |
| Woodie | 67.74 | 70.61 | 72.26 | 75.13 | 76.78 | 79.65 | 81.30 |
| Fibonacci | 70.81 | 72.53 | 73.60 | 75.33 | 77.05 | 78.12 | 79.85 |
Numerical data
The following is the status of technical indicators and moving averages registered at the time this technical analysis was created:
| RSI (14): | 65.85 | |
| MACD (12,26,9): | 0.4300 | |
| Directional Movement: | 14.80 | |
| AROON (14): | 50.00 | |
| DEMA (21): | 76.54 | |
| Parabolic SAR (0,02-0,02-0,2): | 73.75 | |
| Elder Ray (13): | 1.73 | |
| Super Trend (3,10): | 74.83 | |
| Zig ZAG (10): | 78.40 | |
| VORTEX (21): | 0.9800 | |
| Stochastique (14,3,5): | 95.82 | |
| TEMA (21): | 77.00 | |
| Williams %R (14): | -6.39 | |
| Chande Momentum Oscillator (20): | 3.88 | |
| Repulse (5,40,3): | 2.1300 | |
| ROCnROLL: | 1 | |
| TRIX (15,9): | -0.0100 | |
| Courbe Coppock: | 4.68 |
| MA7: | 76.79 | |
| MA20: | 75.58 | |
| MA50: | 76.08 | |
| MA100: | 75.01 | |
| MAexp7: | 77.09 | |
| MAexp20: | 76.17 | |
| MAexp50: | 75.71 | |
| MAexp100: | 73.92 | |
| Price / MA7: | +2.10% | |
| Price / MA20: | +3.73% | |
| Price / MA50: | +3.05% | |
| Price / MA100: | +4.52% | |
| Price / MAexp7: | +1.70% | |
| Price / MAexp20: | +2.93% | |
| Price / MAexp50: | +3.55% | |
| Price / MAexp100: | +6.06% |
News
Don"t forget to follow the news on ORMAT TECHNOLOGIES INC.. At the time of publication of this analysis, the latest news was as follows:
- Report: Exploring Fundamental Drivers Behind Redwood Trust, Extra Space Storage, Aegion, Ormat Technologies, Ruth's Hospitality Group, and SP Plus — New Horizons, Emerging Trends, and Upcoming Developments
- Report: Developing Opportunities within Q2, Ormat Technologies, The Andersons, Comstock Resources, Freshpet, and Curis — Future Expectations, Projections Moving into 2018
- LEAD PLAINTIFF DEADLINE ALERT: Faruqi & Faruqi, LLP Encourages Investors Who Suffered Losses Exceeding $100,000 In Ormat Technologies, Inc. To Contact The Firm
- EQUITY NOTICE: Rosen Law Firm Announces Filing of Securities Class Action Lawsuit on behalf of Ormat Technologies, Inc. Investors; Upcoming Deadline - ORA
- RM LAW Announces Class Action Lawsuit Against Ormat Technologies, Inc.
About author

Online


Add a comment
Comments
0 comments on the analysis ORMAT TECHNOLOGIES INC. - Daily