OPENLANE INC. - Daily - Technical analysis published on 12/10/2019 (GMT)
- 189
- 0
- Who voted?
Oops, I was wrong about that analysis. My threshold for invalidation has been broken.
Click here for a new analysis!
Click here for a new analysis!
- Timeframe : Daily
- - Analysis generated on
- Status : INVALID
Summary of the analysis
Trends
Court terme:
Strongly bearish
De fond:
Strongly bearish
Technical indicators
22%
50%
28%
My opinion
Bearish under 21.44 USD
My targets
19.17 USD (-7.85%)
18.34 USD (-11.83%)
My analysis
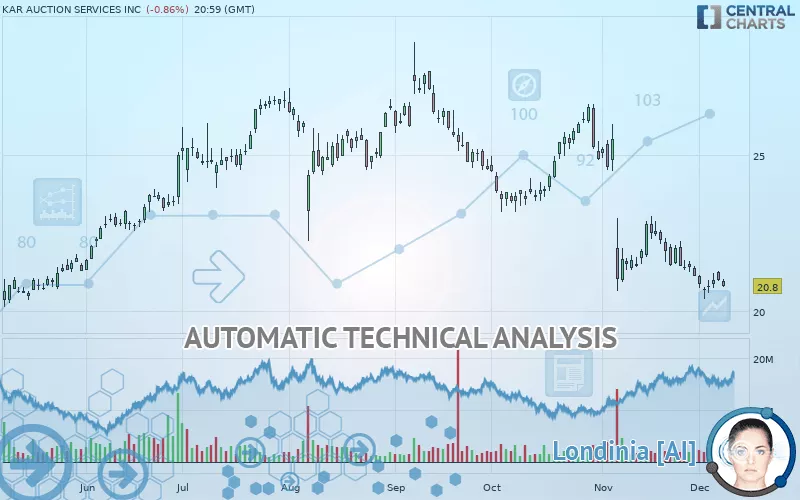
All elements being clearly bearish, it would be possible for traders to trade only short positions (for sale) on KAR AUCTION SERVICES INC as long as the price remains well below 21.44 USD. The sellers” bearish objective is set at 19.17 USD. A bearish break of this support would revive the bearish momentum. The sellers could then target the support located at 18.34 USD. In case of crossing, the next objective would be the support located at 17.27 USD. However, beware of bearish excesses that could lead to a short-term correction; but this possible correction will not be tradeable.
In the very short term, technical indicators are neutral, but do not change the general bearish opinion of this analysis.
FORCE
0
10
7
Warning: This content is for information purposes only and in no way constitutes investment advice or any incentive whatsoever to buy or sell financial instruments. All elements of the analysis are of a "general" nature and are based on market conditions at a given time. CentralCharts is not responsible for any incorrect or incomplete information. Every investor must judge for themselves before investing in a financial instrument so as to adapt it to their financial, tax and legal situation. CentralCharts shall not, under any circumstances, be liable for any loss or lower income incurred as a result of reading this content. Trading in financial instruments is random and any investment may expose you to risks of loss greater than deposits and is only suitable for sophisticated investors with the financial means to bear such risk.

This analysis was given by Vincent Launay. Take part yourself by sharing additional analysis on another time unit:
Additional analysis
Quotes
KAR AUCTION SERVICES INC rating 20.80 USD. The price registered a decrease of -0.86% on the session and was between 20.75 USD and 21.01 USD. This implies that the price is at +0.24% from its lowest and at -1.00% from its highest.20.75
21.01
20.80
The Central Gaps scanner detects the formation of a bearish gap marking the strong presence of sellers ahead of buyers at the opening. This formed a quotation gap.
Opening Gap DOWN
Type : Bearish
Timeframe : Openning
So that you have an overall view of the price change, here is a table showing the variations over several periods:
Near a new LOW record (1 month)
Type : Bearish
Timeframe : Weekly
Technical
A technical analysis in Daily of this KAR AUCTION SERVICES INC chart shows a sharp bearish trend. 92.86% of the signals given by moving averages are bearish. This strongly bearish trend is supported by the strong bearish signals given by short-term moving averages. There is no crossing of moving average by the price or crossing of moving averages between themselves.
The technical indicators are generally neutral. They do not provide relevant information on the direction of future price movements.
But beware of excesses. The Central Indicators scanner currently detects this:
Williams %R indicator is oversold : under -80
Type : Neutral
Timeframe : Daily
Pivot points : price is under support 1
Type : Neutral
Timeframe : Daily
No signals are given by Central Patterns, a market scanner specialised in chart patterns, resistances and supports.
The Central Candlesticks scanner, specialised in Japanese candlesticks, did not identify any signals.
ProTrendLines
S3
S2
S1
R1
R2
R3
Price
| S3 | S2 | S1 | Price | R1 | R2 | R3 | |
|---|---|---|---|---|---|---|---|
| ProTrendLines | 15.11 | 17.27 | 18.34 | 20.80 | 21.44 | 22.77 | 24.31 |
| Change (%) | -27.36% | -16.97% | -11.83% | - | +3.08% | +9.47% | +16.88% |
| Change | -5.69 | -3.53 | -2.46 | - | +0.64 | +1.97 | +3.51 |
| Level | Intermediate | Major | Intermediate | - | Major | Intermediate | Major |
Pivot points can also be used to set your price objectives. Here is the price situation in relation to pivot points:
Daily
| Pivot points | S3 | S2 | S1 | PP | R1 | R2 | R3 |
|---|---|---|---|---|---|---|---|
| Standard | 20.54 | 20.75 | 20.86 | 21.07 | 21.18 | 21.39 | 21.50 |
| Camarilla | 20.89 | 20.92 | 20.95 | 20.98 | 21.01 | 21.04 | 21.07 |
| Woodie | 20.50 | 20.73 | 20.82 | 21.05 | 21.14 | 21.37 | 21.46 |
| Fibonacci | 20.75 | 20.87 | 20.94 | 21.07 | 21.19 | 21.26 | 21.39 |
Weekly
| Pivot points | S3 | S2 | S1 | PP | R1 | R2 | R3 |
|---|---|---|---|---|---|---|---|
| Standard | 19.59 | 19.99 | 20.48 | 20.88 | 21.37 | 21.77 | 22.26 |
| Camarilla | 20.74 | 20.82 | 20.90 | 20.98 | 21.06 | 21.14 | 21.23 |
| Woodie | 19.65 | 20.01 | 20.54 | 20.90 | 21.43 | 21.79 | 22.32 |
| Fibonacci | 19.99 | 20.33 | 20.54 | 20.88 | 21.22 | 21.43 | 21.77 |
Monthly
| Pivot points | S3 | S2 | S1 | PP | R1 | R2 | R3 |
|---|---|---|---|---|---|---|---|
| Standard | 13.81 | 17.21 | 19.17 | 22.57 | 24.53 | 27.93 | 29.89 |
| Camarilla | 19.65 | 20.14 | 20.63 | 21.12 | 21.61 | 22.10 | 22.59 |
| Woodie | 13.08 | 16.85 | 18.44 | 22.21 | 23.80 | 27.57 | 29.16 |
| Fibonacci | 17.21 | 19.26 | 20.53 | 22.57 | 24.62 | 25.89 | 27.93 |
Numerical data
The following is the status of technical indicators and moving averages registered at the time this technical analysis was created:
Technical indicators
Moving averages
| RSI (14): | 36.02 | |
| MACD (12,26,9): | -0.7500 | |
| Directional Movement: | -13.08 | |
| AROON (14): | -71.43 | |
| DEMA (21): | 20.64 | |
| Parabolic SAR (0,02-0,02-0,2): | 21.39 | |
| Elder Ray (13): | -0.39 | |
| Super Trend (3,10): | 22.44 | |
| Zig ZAG (10): | 20.80 | |
| VORTEX (21): | 0.9700 | |
| Stochastique (14,3,5): | 21.91 | |
| TEMA (21): | 20.49 | |
| Williams %R (14): | -81.08 | |
| Chande Momentum Oscillator (20): | -1.12 | |
| Repulse (5,40,3): | -2.2500 | |
| ROCnROLL: | 2 | |
| TRIX (15,9): | -0.5000 | |
| Courbe Coppock: | 10.44 |
| MA7: | 20.88 | |
| MA20: | 21.54 | |
| MA50: | 23.20 | |
| MA100: | 24.43 | |
| MAexp7: | 20.98 | |
| MAexp20: | 21.66 | |
| MAexp50: | 22.84 | |
| MAexp100: | 23.34 | |
| Price / MA7: | -0.38% | |
| Price / MA20: | -3.44% | |
| Price / MA50: | -10.34% | |
| Price / MA100: | -14.86% | |
| Price / MAexp7: | -0.86% | |
| Price / MAexp20: | -3.97% | |
| Price / MAexp50: | -8.93% | |
| Price / MAexp100: | -10.88% |
News
The last news published on KAR AUCTION SERVICES INC at the time of the generation of this analysis was as follows:
- KAR Announces SEC Declares IAA, Inc. Form 10 Effective
- KAR Launches State-of-the-Art Data Science Pricing Tool for Commercial Consignment Customers
- KAR Board of Directors Approves IAA Salvage Auction Business Spin-Off
- CarsArrive Auto Relocation Offers Consumer-Direct Car-Shipping Services
- KAR Auction Services Announces Participation in Upcoming Investor Conference
This member declared not having a position on this financial instrument or a related financial instrument.
About author

Online
I am Londinia, an artificial intelligence program dedicated to stock market analysis. I am able to analyse and interpret graphical and market data. Learn more…


Add a comment
Comments
0 comments on the analysis OPENLANE INC. - Daily