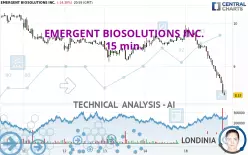
EMERGENT BIOSOLUTIONS INC. - 15 min. - Technical analysis published on 02/18/2025 (GMT)
- 99
- 0
Click here for a new analysis!
- Timeframe : 15 min.
- - Analysis generated on
- Status : TARGET REACHED

Summary of the analysis

Additional analysis
Quotes
EMERGENT BIOSOLUTIONS INC. rating 8.34 USD. The price is lower by -14.20% since the last closing with the lowest point at 8.33 USD and the highest point at 9.96 USD. The deviation from the price is +0.12% for the low point and -16.27% for the high point.A bullish gap was detected at the opening by the Central Gaps scanner. There are a lot of buyers and they have the upper hand in the very short term.
Opening Gap UP
Type : Bullish
Timeframe : Openning
A study of price movements over other periods shows the following variations:
New LOW record (1st january)
Type : Bearish
Timeframe : Weekly
New LOW record (1 month)
Type : Bearish
Timeframe : Weekly
Technical
Technical analysis of this 15 min. chart of EMERGENT BIOSOLUTIONS INC. indicates that the overall trend is strongly bearish. 92.86% of the signals given by moving averages are bearish. The overall trend is supported by the strong bearish signals from short-term moving averages. The Central Indicators scanner detects a bearish signal on moving averages that could impact this trend:
Moving Average bearish crossovers : MA50 & MA100
Type : Bearish
Timeframe : 15 minutes
In fact, according to the parameters integrated into the Central Analyzer system, 14 technical indicators out of 18 analysed are currently bearish. Caution: the Central Indicators scanner currently detects an excess:
RSI indicator is oversold : under 20
Type : Neutral
Timeframe : 15 minutes
CCI indicator is oversold : under -100
Type : Neutral
Timeframe : 15 minutes
Williams %R indicator is oversold : under -80
Type : Neutral
Timeframe : 15 minutes
Pivot points : price is under support 3
Type : Neutral
Timeframe : 15 minutes
Pivot points : price is under support 3
Type : Neutral
Timeframe : Weekly
Central Patterns, the scanner specializing in chart patterns, did not identify any signals.
No result was found by the Central Candlesticks scanner on Japanese candlesticks.
| S3 | S2 | S1 | Price | R1 | R2 | R3 | |
|---|---|---|---|---|---|---|---|
| ProTrendLines | 4.64 | 5.95 | 7.72 | 8.34 | 9.20 | 9.62 | 10.12 |
| Change (%) | -44.36% | -28.66% | -7.43% | - | +10.31% | +15.35% | +21.34% |
| Change | -3.70 | -2.39 | -0.62 | - | +0.86 | +1.28 | +1.78 |
| Level | Minor | Minor | Minor | - | Major | Major | Intermediate |
Pivot points can also be used to set your price objectives. Here is the price situation in relation to pivot points:
| Pivot points | S3 | S2 | S1 | PP | R1 | R2 | R3 |
|---|---|---|---|---|---|---|---|
| Standard | 6.16 | 7.25 | 7.79 | 8.88 | 9.42 | 10.51 | 11.05 |
| Camarilla | 7.89 | 8.04 | 8.19 | 8.34 | 8.49 | 8.64 | 8.79 |
| Woodie | 5.90 | 7.11 | 7.53 | 8.74 | 9.16 | 10.37 | 10.79 |
| Fibonacci | 7.25 | 7.87 | 8.25 | 8.88 | 9.50 | 9.88 | 10.51 |
| Pivot points | S3 | S2 | S1 | PP | R1 | R2 | R3 |
|---|---|---|---|---|---|---|---|
| Standard | 7.68 | 8.39 | 9.06 | 9.77 | 10.44 | 11.15 | 11.82 |
| Camarilla | 9.34 | 9.47 | 9.59 | 9.72 | 9.85 | 9.97 | 10.10 |
| Woodie | 7.65 | 8.38 | 9.03 | 9.76 | 10.41 | 11.14 | 11.79 |
| Fibonacci | 8.39 | 8.92 | 9.25 | 9.77 | 10.30 | 10.63 | 11.15 |
| Pivot points | S3 | S2 | S1 | PP | R1 | R2 | R3 |
|---|---|---|---|---|---|---|---|
| Standard | 6.86 | 8.03 | 9.64 | 10.81 | 12.42 | 13.59 | 15.20 |
| Camarilla | 10.49 | 10.74 | 11.00 | 11.25 | 11.51 | 11.76 | 12.02 |
| Woodie | 7.08 | 8.14 | 9.86 | 10.92 | 12.64 | 13.70 | 15.42 |
| Fibonacci | 8.03 | 9.09 | 9.75 | 10.81 | 11.87 | 12.53 | 13.59 |
Numerical data
The following are the details of the technical indicators and moving averages that were collected to generate this technical analysis:
| RSI (14): | 11.64 | |
| MACD (12,26,9): | -0.2600 | |
| Directional Movement: | -47.62 | |
| AROON (14): | -92.86 | |
| DEMA (21): | 8.73 | |
| Parabolic SAR (0,02-0,02-0,2): | 8.90 | |
| Elder Ray (13): | -0.43 | |
| Super Trend (3,10): | 8.87 | |
| Zig ZAG (10): | 8.33 | |
| VORTEX (21): | 0.4200 | |
| Stochastique (14,3,5): | 1.36 | |
| TEMA (21): | 8.54 | |
| Williams %R (14): | -100.00 | |
| Chande Momentum Oscillator (20): | -1.11 | |
| Repulse (5,40,3): | -6.5900 | |
| ROCnROLL: | 2 | |
| TRIX (15,9): | -0.2800 | |
| Courbe Coppock: | 16.26 |
| MA7: | 9.54 | |
| MA20: | 10.45 | |
| MA50: | 9.66 | |
| MA100: | 9.41 | |
| MAexp7: | 8.69 | |
| MAexp20: | 9.04 | |
| MAexp50: | 9.30 | |
| MAexp100: | 9.47 | |
| Price / MA7: | -12.58% | |
| Price / MA20: | -20.19% | |
| Price / MA50: | -13.66% | |
| Price / MA100: | -11.37% | |
| Price / MAexp7: | -4.14% | |
| Price / MAexp20: | -7.85% | |
| Price / MAexp50: | -10.43% | |
| Price / MAexp100: | -12.04% |
News
The last news published on EMERGENT BIOSOLUTIONS INC. at the time of the generation of this analysis was as follows:
- Emergent BioSolutions Partners with Emmitt Smith to Launch Ready to Rescue Campaign to Help Save Lives Amidst Rising Opioid Epidemic
- SHAREHOLDER ALERT: Purcell & Lefkowitz LLP Is Investigating Emergent BioSolutions Inc. for Potential Breaches of Fiduciary Duty By Its Board of Directors
- Thinking about buying stock in Spruce Biosciences, CytomX Therapeutics, Boxed, Mobile Global Esports, or Emergent Biosolutions?
- Thinking about buying stock in SIGA Technologies, Geovax Labs, Inovio Pharmaceuticals, ImmunoGen, or Emergent Biosolutions?
- Thinking about buying stock in Rivian Automotive, Siyata Mobile, Emergent Biosolutions, Stryve Foods, or IQIYI?
About author

Online


Add a comment
Comments
0 comments on the analysis EMERGENT BIOSOLUTIONS INC. - 15 min.