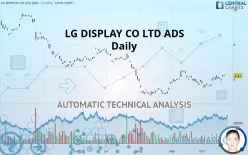
LG DISPLAY CO LTD ADS - Daily - Technical analysis published on 10/23/2019 (GMT)
- 242
- 0
- Who voted?
Click here for a new analysis!
- Timeframe : Daily
- - Analysis generated on
- Status : INVALID

Summary of the analysis

Additional analysis
Quotes
LG DISPLAY CO LTD ADS rating 6.21 USD. On the day, this instrument lost -0.48% and was traded between 6.18 USD and 6.25 USD over the period. The price is currently at +0.49% from its lowest and -0.64% from its highest.A bearish opening was detected by the Central Gaps scanner. Sellers are trying to impose a bearish trend in the very short term.
Bearish opening
Type : Bearish
Timeframe : Openning
Here is a more detailed summary of the historical variations registered by LG DISPLAY CO LTD ADS:
Near a new HIGH record (1 month)
Type : Bullish
Timeframe : Weekly
Technical
A technical analysis in Daily of this LG DISPLAY CO LTD ADS chart shows a neutral trend. The trend could quickly turn bullish due to the strong bullish signals currently being given by short-term moving averages. The Central Indicators scanner detects bullish and bearish signals on moving averages that could impact this trend:
Bullish trend reversal : Moving Average 20
Type : Bullish
Timeframe : Daily
Moving Average bearish crossovers : AMA20 & AMA50
Type : Bearish
Timeframe : Daily
Bullish price crossover with adaptative moving average 20
Type : Bullish
Timeframe : Daily
Bullish price crossover with adaptative moving average 50
Type : Bullish
Timeframe : Daily
Bullish price crossover with adaptative moving average 100
Type : Bullish
Timeframe : Daily
In fact, 14 technical indicators on 18 studied are currently bullish. But beware of excesses. The Central Indicators scanner currently detects this:
CCI indicator is overbought : over 100
Type : Neutral
Timeframe : Daily
Williams %R indicator is overbought : over -20
Type : Neutral
Timeframe : Daily
Pivot points : price is over resistance 1
Type : Neutral
Timeframe : Weekly
Price is back over the pivot point
Type : Bullish
Timeframe : Daily
No signals are given by Central Patterns, a market scanner specialised in chart patterns, resistances and supports.
Central Candlesticks, the scanner specialised in Japanese candlesticks, detects a bullish signal that could support the hypothesis of a small rebound in the very short term:
Abandoned baby morning star
Type : Bullish
Timeframe : Daily
| S3 | S2 | S1 | Price | R1 | R2 | R3 | |
|---|---|---|---|---|---|---|---|
| ProTrendLines | 5.14 | 5.54 | 6.18 | 6.21 | 6.81 | 7.79 | 8.57 |
| Change (%) | -17.23% | -10.79% | -0.48% | - | +9.66% | +25.44% | +38.00% |
| Change | -1.07 | -0.67 | -0.03 | - | +0.60 | +1.58 | +2.36 |
| Level | Intermediate | Major | Intermediate | - | Intermediate | Minor | Intermediate |
Attention could also be paid to pivot points to set price objectives:
| Pivot points | S3 | S2 | S1 | PP | R1 | R2 | R3 |
|---|---|---|---|---|---|---|---|
| Standard | 6.05 | 6.09 | 6.17 | 6.21 | 6.29 | 6.33 | 6.41 |
| Camarilla | 6.21 | 6.22 | 6.23 | 6.24 | 6.25 | 6.26 | 6.27 |
| Woodie | 6.06 | 6.10 | 6.18 | 6.22 | 6.30 | 6.34 | 6.42 |
| Fibonacci | 6.09 | 6.14 | 6.17 | 6.21 | 6.26 | 6.29 | 6.33 |
| Pivot points | S3 | S2 | S1 | PP | R1 | R2 | R3 |
|---|---|---|---|---|---|---|---|
| Standard | 5.52 | 5.73 | 5.83 | 6.04 | 6.14 | 6.35 | 6.45 |
| Camarilla | 5.86 | 5.88 | 5.91 | 5.94 | 5.97 | 6.00 | 6.03 |
| Woodie | 5.48 | 5.70 | 5.79 | 6.01 | 6.10 | 6.32 | 6.41 |
| Fibonacci | 5.73 | 5.85 | 5.92 | 6.04 | 6.16 | 6.23 | 6.35 |
| Pivot points | S3 | S2 | S1 | PP | R1 | R2 | R3 |
|---|---|---|---|---|---|---|---|
| Standard | 4.71 | 5.19 | 5.57 | 6.05 | 6.43 | 6.91 | 7.29 |
| Camarilla | 5.71 | 5.79 | 5.87 | 5.95 | 6.03 | 6.11 | 6.19 |
| Woodie | 4.66 | 5.17 | 5.52 | 6.03 | 6.38 | 6.89 | 7.24 |
| Fibonacci | 5.19 | 5.52 | 5.72 | 6.05 | 6.38 | 6.58 | 6.91 |
Numerical data
The following is the status of technical indicators and moving averages registered at the time this technical analysis was created:
| RSI (14): | 58.31 | |
| MACD (12,26,9): | 0.0700 | |
| Directional Movement: | 15.49 | |
| AROON (14): | 85.72 | |
| DEMA (21): | 6.06 | |
| Parabolic SAR (0,02-0,02-0,2): | 5.77 | |
| Elder Ray (13): | 0.19 | |
| Super Trend (3,10): | 5.72 | |
| Zig ZAG (10): | 6.21 | |
| VORTEX (21): | 0.8400 | |
| Stochastique (14,3,5): | 82.96 | |
| TEMA (21): | 6.14 | |
| Williams %R (14): | -6.76 | |
| Chande Momentum Oscillator (20): | 0.48 | |
| Repulse (5,40,3): | 1.2600 | |
| ROCnROLL: | 1 | |
| TRIX (15,9): | 0.0700 | |
| Courbe Coppock: | 11.75 |
| MA7: | 6.11 | |
| MA20: | 5.90 | |
| MA50: | 5.81 | |
| MA100: | 6.35 | |
| MAexp7: | 6.10 | |
| MAexp20: | 5.99 | |
| MAexp50: | 6.02 | |
| MAexp100: | 6.39 | |
| Price / MA7: | +1.64% | |
| Price / MA20: | +5.25% | |
| Price / MA50: | +6.88% | |
| Price / MA100: | -2.20% | |
| Price / MAexp7: | +1.80% | |
| Price / MAexp20: | +3.67% | |
| Price / MAexp50: | +3.16% | |
| Price / MAexp100: | -2.82% |
News
Don"t forget to follow the news on LG DISPLAY CO LTD ADS. At the time of publication of this analysis, the latest news was as follows:
- LG Display to Showcase Luflex OLED Lighting Products At Light+Building 2018 in Frankfurt, Germany
-
 CES 2018: LG Display shows off large rollable TV screen- BBC News
- MagnaChip Selected as "2016 Best Supplier" by LG Display
About author

Online


Add a comment
Comments
0 comments on the analysis LG DISPLAY CO LTD ADS - Daily