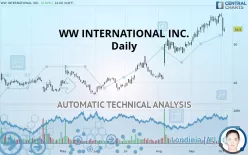
WW INTERNATIONAL INC. - Daily - Technical analysis published on 10/03/2019 (GMT)
- 296
- 0
- Who voted?
Click here for a new analysis!
- Timeframe : Daily
- - Analysis generated on
- Status : TARGET REACHED

Summary of the analysis

Additional analysis
Quotes
The WW INTERNATIONAL INC. rating is 33.90 USD. The price registered an increase of +0.92% on the session and was traded between 33.12 USD and 34.46 USD over the period. The price is currently at +2.36% from its lowest and -1.63% from its highest.A study of price movements over other periods shows the following variations:
Technical
A technical analysis in Daily of this WW INTERNATIONAL INC. chart shows a bullish trend. 75% of the signals given by moving averages are bullish. Caution: the neutral signals currently given by short-term moving averages show us that the global trend is losing momentum. The Central Indicators scanner detects bearish signals on moving averages that could impact this trend:
Bearish trend reversal : adaptative moving average 20
Type : Bearish
Timeframe : Daily
Bearish price crossover with Moving Average 20
Type : Bearish
Timeframe : Daily
Bearish price crossover with adaptative moving average 20
Type : Bearish
Timeframe : Daily
An assessment of technical indicators does not currently provide any relevant information to suggest whether the signal given by the technical indicators is more bullish or bearish.
Central Indicators, the scanner specialised in technical indicators, has identified these signals:
Pivot points : price is under support 2
Type : Neutral
Timeframe : Weekly
RSI indicator is back under 50
Type : Bearish
Timeframe : Daily
Parabolic SAR indicator bearish reversal
Type : Bearish
Timeframe : Daily
Price is back under the pivot point
Type : Bearish
Timeframe : Daily
Momentum indicator is back under 0
Type : Bearish
Timeframe : Daily
Williams %R indicator is back under -50
Type : Bearish
Timeframe : Daily
The analysis of the price chart with Central Patterns scanners does not return any result.
Central Candlesticks, the scanner specialised in Japanese candlesticks, detects a bearish signal that could support the hypothesis of a small drop in the very short term:
Long black line
Type : Bearish
Timeframe : Daily
| S3 | S2 | S1 | Price | R1 | R2 | R3 | |
|---|---|---|---|---|---|---|---|
| ProTrendLines | 23.14 | 27.71 | 29.88 | 33.90 | 37.12 | 39.50 | 42.76 |
| Change (%) | -31.74% | -18.26% | -11.86% | - | +9.50% | +16.52% | +26.14% |
| Change | -10.76 | -6.19 | -4.02 | - | +3.22 | +5.60 | +8.86 |
| Level | Minor | Intermediate | Major | - | Major | Minor | Major |
Attention could also be paid to pivot points to set price objectives:
| Pivot points | S3 | S2 | S1 | PP | R1 | R2 | R3 |
|---|---|---|---|---|---|---|---|
| Standard | 26.50 | 29.26 | 31.43 | 34.19 | 36.35 | 39.11 | 41.28 |
| Camarilla | 32.24 | 32.69 | 33.14 | 33.59 | 34.04 | 34.49 | 34.95 |
| Woodie | 26.20 | 29.11 | 31.13 | 34.04 | 36.05 | 38.96 | 40.98 |
| Fibonacci | 29.26 | 31.14 | 32.30 | 34.19 | 36.07 | 37.23 | 39.11 |
| Pivot points | S3 | S2 | S1 | PP | R1 | R2 | R3 |
|---|---|---|---|---|---|---|---|
| Standard | 33.01 | 33.90 | 35.63 | 36.52 | 38.25 | 39.14 | 40.87 |
| Camarilla | 36.63 | 36.87 | 37.11 | 37.35 | 37.59 | 37.83 | 38.07 |
| Woodie | 33.42 | 34.11 | 36.04 | 36.73 | 38.66 | 39.35 | 41.28 |
| Fibonacci | 33.90 | 34.90 | 35.52 | 36.52 | 37.52 | 38.14 | 39.14 |
| Pivot points | S3 | S2 | S1 | PP | R1 | R2 | R3 |
|---|---|---|---|---|---|---|---|
| Standard | 23.98 | 26.80 | 32.31 | 35.13 | 40.64 | 43.46 | 48.97 |
| Camarilla | 35.53 | 36.29 | 37.06 | 37.82 | 38.58 | 39.35 | 40.11 |
| Woodie | 25.33 | 27.47 | 33.66 | 35.80 | 41.99 | 44.13 | 50.32 |
| Fibonacci | 26.80 | 29.98 | 31.95 | 35.13 | 38.31 | 40.28 | 43.46 |
Numerical data
The following is the status of technical indicators and moving averages registered at the time this technical analysis was created:
| RSI (14): | 49.96 | |
| MACD (12,26,9): | 1.4300 | |
| Directional Movement: | -6.33 | |
| AROON (14): | -7.15 | |
| DEMA (21): | 36.99 | |
| Parabolic SAR (0,02-0,02-0,2): | 38.11 | |
| Elder Ray (13): | -1.69 | |
| Super Trend (3,10): | 33.03 | |
| Zig ZAG (10): | 34.21 | |
| VORTEX (21): | 1.0600 | |
| Stochastique (14,3,5): | 49.58 | |
| TEMA (21): | 36.53 | |
| Williams %R (14): | -63.84 | |
| Chande Momentum Oscillator (20): | -1.08 | |
| Repulse (5,40,3): | -3.0100 | |
| ROCnROLL: | -1 | |
| TRIX (15,9): | 0.9000 | |
| Courbe Coppock: | 11.38 |
| MA7: | 36.02 | |
| MA20: | 35.32 | |
| MA50: | 30.52 | |
| MA100: | 25.55 | |
| MAexp7: | 35.56 | |
| MAexp20: | 34.75 | |
| MAexp50: | 31.34 | |
| MAexp100: | 28.81 | |
| Price / MA7: | -5.89% | |
| Price / MA20: | -4.02% | |
| Price / MA50: | +11.07% | |
| Price / MA100: | +32.68% | |
| Price / MAexp7: | -4.67% | |
| Price / MAexp20: | -2.45% | |
| Price / MAexp50: | +8.17% | |
| Price / MAexp100: | +17.67% |
News
Don"t forget to follow the news on WW INTERNATIONAL INC.. At the time of publication of this analysis, the latest news was as follows:
-
 Weight Watchers Has Become WW
- WW to Transfer Stock Exchange Listing to Nasdaq
- WW Announces Participation in Upcoming Investor Conferences
-
Weight Watchers changes its name and people lost it
- Weight Watchers Becomes WW, Reinforcing Its Mission to Focus on Overall Health and Wellbeing
About author

Online


Add a comment
Comments
0 comments on the analysis WW INTERNATIONAL INC. - Daily