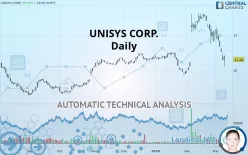
UNISYS CORP. - Daily - Technical analysis published on 03/11/2020 (GMT)
- 452
- 0
- Who voted?
Click here for a new analysis!
- Timeframe : Daily
- - Analysis generated on
- Status : TARGET REACHED

Summary of the analysis

Additional analysis
Quotes
UNISYS CORP. rating 11.48 USD. The price is lower by +0.53% since the last closing with the lowest point at 10.51 USD and the highest point at 12.05 USD. The deviation from the price is +9.23% for the low point and -4.73% for the high point.The Central Gaps scanner detects a bullish opening. A small advantage for buyers in the very short term.
Bullish opening
Type : Bullish
Timeframe : Openning
Here is a more detailed summary of the historical variations registered by UNISYS CORP.:
Technical
Technical analysis of UNISYS CORP. in Daily shows an overall slightly bearish trend. 60.71% of the signals given by moving averages are bearish. The overall trend could accelerate as a result of the strong bearish signals from short-term moving averages. An assessment of moving averages reveals several bearish signals that could impact this trend:
Bearish trend reversal : Moving Average 50
Type : Bearish
Timeframe : Daily
Bearish trend reversal : adaptative moving average 100
Type : Bearish
Timeframe : Daily
Moving Average bearish crossovers : AMA20 & AMA50
Type : Bearish
Timeframe : Daily
Bearish price crossover with Moving Average 100
Type : Bearish
Timeframe : Daily
An assessment of technical indicators shows a strong bearish signal.
Caution: the Central Indicators scanner currently detects an excess:
CCI indicator is oversold : under -100
Type : Neutral
Timeframe : Daily
Williams %R indicator is oversold : under -80
Type : Neutral
Timeframe : Daily
MACD indicator is back under 0
Type : Bearish
Timeframe : Daily
Price is back under the pivot point
Type : Bearish
Timeframe : Daily
Price is back under the pivot point
Type : Bearish
Timeframe : Weekly
No signals are given by Central Patterns, a market scanner specialised in chart patterns, resistances and supports.
For a small setback in the very short term, the Central Candlesticks scanner currently notes the presence of this bearish pattern in Japanese candlesticks:
Downside gap
Type : Bearish
Timeframe : Daily
| S3 | S2 | S1 | Price | R1 | R2 | R3 | |
|---|---|---|---|---|---|---|---|
| ProTrendLines | 7.90 | 9.01 | 10.65 | 11.48 | 12.52 | 14.35 | 16.40 |
| Change (%) | -31.18% | -21.52% | -7.23% | - | +9.06% | +25.00% | +42.86% |
| Change | -3.58 | -2.47 | -0.83 | - | +1.04 | +2.87 | +4.92 |
| Level | Minor | Major | Intermediate | - | Major | Major | Major |
To determine price objectives, it is also possible to use the pivot points. Here is the price position in relation to pivot points:
| Pivot points | S3 | S2 | S1 | PP | R1 | R2 | R3 |
|---|---|---|---|---|---|---|---|
| Standard | 10.31 | 10.85 | 11.14 | 11.68 | 11.97 | 12.51 | 12.80 |
| Camarilla | 11.19 | 11.27 | 11.34 | 11.42 | 11.50 | 11.57 | 11.65 |
| Woodie | 10.18 | 10.79 | 11.01 | 11.62 | 11.84 | 12.45 | 12.67 |
| Fibonacci | 10.85 | 11.17 | 11.37 | 11.68 | 12.00 | 12.20 | 12.51 |
| Pivot points | S3 | S2 | S1 | PP | R1 | R2 | R3 |
|---|---|---|---|---|---|---|---|
| Standard | 7.86 | 10.18 | 11.44 | 13.76 | 15.02 | 17.34 | 18.60 |
| Camarilla | 11.71 | 12.03 | 12.36 | 12.69 | 13.02 | 13.35 | 13.67 |
| Woodie | 7.32 | 9.92 | 10.90 | 13.50 | 14.48 | 17.08 | 18.06 |
| Fibonacci | 10.18 | 11.55 | 12.40 | 13.76 | 15.13 | 15.98 | 17.34 |
| Pivot points | S3 | S2 | S1 | PP | R1 | R2 | R3 |
|---|---|---|---|---|---|---|---|
| Standard | 2.06 | 5.80 | 10.66 | 14.40 | 19.26 | 23.00 | 27.86 |
| Camarilla | 13.17 | 13.95 | 14.74 | 15.53 | 16.32 | 17.11 | 17.90 |
| Woodie | 2.63 | 6.08 | 11.23 | 14.68 | 19.83 | 23.28 | 28.43 |
| Fibonacci | 5.80 | 9.08 | 11.11 | 14.40 | 17.68 | 19.71 | 23.00 |
Numerical data
The following are the details of the technical indicators and moving averages that were collected to generate this technical analysis:
| RSI (14): | 32.38 | |
| MACD (12,26,9): | -0.3400 | |
| Directional Movement: | -26.21 | |
| AROON (14): | -100.00 | |
| DEMA (21): | 14.11 | |
| Parabolic SAR (0,02-0,02-0,2): | 16.69 | |
| Elder Ray (13): | -2.61 | |
| Super Trend (3,10): | 14.72 | |
| Zig ZAG (10): | 11.48 | |
| VORTEX (21): | 0.7700 | |
| Stochastique (14,3,5): | 5.53 | |
| TEMA (21): | 13.08 | |
| Williams %R (14): | -86.93 | |
| Chande Momentum Oscillator (20): | -5.58 | |
| Repulse (5,40,3): | -10.1200 | |
| ROCnROLL: | 2 | |
| TRIX (15,9): | 0.5000 | |
| Courbe Coppock: | 45.44 |
| MA7: | 13.35 | |
| MA20: | 15.53 | |
| MA50: | 13.29 | |
| MA100: | 11.93 | |
| MAexp7: | 13.02 | |
| MAexp20: | 14.17 | |
| MAexp50: | 13.51 | |
| MAexp100: | 12.35 | |
| Price / MA7: | -14.01% | |
| Price / MA20: | -26.08% | |
| Price / MA50: | -13.62% | |
| Price / MA100: | -3.77% | |
| Price / MAexp7: | -11.83% | |
| Price / MAexp20: | -18.98% | |
| Price / MAexp50: | -15.03% | |
| Price / MAexp100: | -7.04% |
News
The latest news and videos published on UNISYS CORP. at the time of the analysis were as follows:
- Unisys Announces Range of Key Public Sector Contract Wins Across the Globe
- European Fisheries Control Agency Awards Contract to Unisys for IT Services and Support to Help Preserve Fish Stocks
- Unisys Corporation - Full year/4th quarter financial results
- Unisys Announces Full-Year and 4Q19 Results; Achieves All Guided Metrics
- Unisys Launches Global Security Channel Partner Program for Resellers of Unisys Stealth® and Other Security Solutions
About author

Online


Add a comment
Comments
0 comments on the analysis UNISYS CORP. - Daily