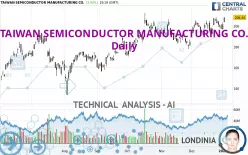
TAIWAN SEMICONDUCTOR MANUFACTURING CO. - Daily - Technical analysis published on 01/03/2025 (GMT)
- 142
- 0
Click here for a new analysis!
- Timeframe : Daily
- - Analysis generated on
- Status : INVALID

Summary of the analysis

Additional analysis
Quotes
TAIWAN SEMICONDUCTOR MANUFACTURING CO. rating 208.43 USD. The price has increased by +3.40% since the last closing and was traded between 203.70 USD and 208.54 USD over the period. The price is currently at +2.32% from its lowest and -0.05% from its highest.The Central Gaps scanner detects the formation of a bullish gap marking the strong presence of buyers against sellers at the opening. This formed a quotation gap.
Opening Gap UP
Type : Bullish
Timeframe : Openning
So that you have an overall view of the price change, here is a table showing the variations over several periods:
Near a new HIGH record (5 years)
Type : Bullish
Timeframe : Weekly
Near a new HIGH record (1 year)
Type : Bullish
Timeframe : Weekly
New HIGH record (1st january)
Type : Bullish
Timeframe : Weekly
Near a new HIGH record (1 month)
Type : Bullish
Timeframe : Weekly
Technical
A technical analysis in Daily of this TAIWAN SEMICONDUCTOR MANUFACTURING CO. chart shows a strongly bullish trend. 92.86% of the signals given by moving averages are bullish. This strongly bullish trend is supported by the strong bullish signals given by short-term moving averages. The Central Indicators scanner detects a bullish signal on moving averages that could impact this trend:
Bullish trend reversal : Moving Average 50
Type : Bullish
Timeframe : Daily
In fact, 16 technical indicators on 18 studied are currently bullish. Caution: the Central Indicators scanner currently detects an excess:
CCI indicator is overbought : over 100
Type : Neutral
Timeframe : Daily
Williams %R indicator is overbought : over -20
Type : Neutral
Timeframe : Daily
Pivot points : price is over resistance 1
Type : Neutral
Timeframe : Weekly
Pivot points : price is over resistance 2
Type : Neutral
Timeframe : Daily
MACD crosses UP its Moving Average
Type : Bullish
Timeframe : Daily
An analysis of the price chart with the Central Patterns scanner (detector of chart patterns and resistances and supports) shows several results that can have an impact on the price change:
Near resistance of channel
Type : Bearish
Timeframe : Daily
Near horizontal support
Type : Bullish
Timeframe : Daily
The Central Candlesticks scanner which studies Japanese candlesticks did not detect anything.
| S3 | S2 | S1 | Price | |
|---|---|---|---|---|
| ProTrendLines | 166.69 | 189.74 | 205.18 | 208.43 |
| Change (%) | -20.03% | -8.97% | -1.56% | - |
| Change | -41.74 | -18.69 | -3.25 | - |
| Level | Minor | Major | Major | - |
Pivot points can also be used to set your price objectives. Here is the price situation in relation to pivot points:
| Pivot points | S3 | S2 | S1 | PP | R1 | R2 | R3 |
|---|---|---|---|---|---|---|---|
| Standard | 190.51 | 193.60 | 197.59 | 200.68 | 204.67 | 207.76 | 211.75 |
| Camarilla | 199.63 | 200.28 | 200.93 | 201.58 | 202.23 | 202.88 | 203.53 |
| Woodie | 190.96 | 193.83 | 198.04 | 200.91 | 205.12 | 207.99 | 212.20 |
| Fibonacci | 193.60 | 196.31 | 197.98 | 200.68 | 203.39 | 205.06 | 207.76 |
| Pivot points | S3 | S2 | S1 | PP | R1 | R2 | R3 |
|---|---|---|---|---|---|---|---|
| Standard | 188.62 | 193.84 | 197.73 | 202.95 | 206.84 | 212.06 | 215.95 |
| Camarilla | 199.13 | 199.96 | 200.80 | 201.63 | 202.47 | 203.30 | 204.14 |
| Woodie | 187.97 | 193.51 | 197.08 | 202.62 | 206.19 | 211.73 | 215.30 |
| Fibonacci | 193.84 | 197.32 | 199.47 | 202.95 | 206.43 | 208.58 | 212.06 |
| Pivot points | S3 | S2 | S1 | PP | R1 | R2 | R3 |
|---|---|---|---|---|---|---|---|
| Standard | 168.01 | 178.18 | 187.83 | 198.00 | 207.65 | 217.82 | 227.47 |
| Camarilla | 192.04 | 193.86 | 195.67 | 197.49 | 199.31 | 201.12 | 202.94 |
| Woodie | 167.76 | 178.05 | 187.58 | 197.87 | 207.40 | 217.69 | 227.22 |
| Fibonacci | 178.18 | 185.75 | 190.43 | 198.00 | 205.57 | 210.25 | 217.82 |
Numerical data
The following is the status of the technical indicators and moving averages at the time of publication of this technical analysis:
| RSI (14): | 60.50 | |
| MACD (12,26,9): | 2.8100 | |
| Directional Movement: | 7.34 | |
| AROON (14): | 100.00 | |
| DEMA (21): | 203.25 | |
| Parabolic SAR (0,02-0,02-0,2): | 195.23 | |
| Elder Ray (13): | 4.95 | |
| Super Trend (3,10): | 188.26 | |
| Zig ZAG (10): | 208.39 | |
| VORTEX (21): | 0.9800 | |
| Stochastique (14,3,5): | 65.72 | |
| TEMA (21): | 204.09 | |
| Williams %R (14): | -0.76 | |
| Chande Momentum Oscillator (20): | 6.19 | |
| Repulse (5,40,3): | 3.1400 | |
| ROCnROLL: | 1 | |
| TRIX (15,9): | 0.1900 | |
| Courbe Coppock: | 5.66 |
| MA7: | 202.70 | |
| MA20: | 199.93 | |
| MA50: | 195.15 | |
| MA100: | 185.43 | |
| MAexp7: | 202.61 | |
| MAexp20: | 199.63 | |
| MAexp50: | 194.54 | |
| MAexp100: | 186.27 | |
| Price / MA7: | +2.83% | |
| Price / MA20: | +4.25% | |
| Price / MA50: | +6.81% | |
| Price / MA100: | +12.40% | |
| Price / MAexp7: | +2.87% | |
| Price / MAexp20: | +4.41% | |
| Price / MAexp50: | +7.14% | |
| Price / MAexp100: | +11.90% |
News
The last news published on TAIWAN SEMICONDUCTOR MANUFACTURING CO. at the time of the generation of this analysis was as follows:
-
 Nvidia, Broadcom and Taiwan Semiconductor Forecast: NVDA, AVGO, TSM Technical Analysis (December 30)
- Thinking about trading options or stock in Amazon.com, Super Micro Computer, Taiwan Semiconductor, Microsoft, or Intel?
- Thinking about trading options or stock in Apple, Pfizer, Taiwan Semiconductor, Microsoft, or Novo Nordisk?
- Thinking about trading options or stock in Tesla, Taiwan Semiconductor, Microsoft, Marathon Digital, or Gitlab?
- Thinking about trading options or stock in Taiwan Semiconductor, Microsoft, Tesla, Meta, or Qualcomm?
About author
Online


Add a comment
Comments
0 comments on the analysis TAIWAN SEMICONDUCTOR MANUFACTURING CO. - Daily