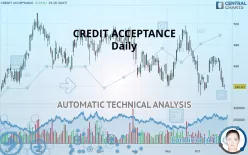
CREDIT ACCEPTANCE - Daily - Technical analysis published on 10/25/2019 (GMT)
- 194
- 0
- Who voted?
Click here for a new analysis!
- Timeframe : Daily
- - Analysis generated on
- Status : TARGET REACHED

Summary of the analysis

Additional analysis
Quotes
CREDIT ACCEPTANCE rating 440.01 USD. The price registered an increase of +0.01% on the session and was traded between 437.86 USD and 442.87 USD over the period. The price is currently at +0.49% from its lowest and -0.65% from its highest.Here is a more detailed summary of the historical variations registered by CREDIT ACCEPTANCE:
Near a new LOW record (1 month)
Type : Bearish
Timeframe : Weekly
Technical
Technical analysis of this Daily chart of CREDIT ACCEPTANCE indicates that the overall trend is strongly bearish. 92.86% of the signals given by moving averages are bearish. The overall trend is supported by the strong bearish signals from short-term moving averages. There is no crossing of moving average by the price or crossing of moving averages between themselves.
In fact, of the 18 technical indicators analysed by Central Analyzer, 5 are bullish, 4 are neutral and 9 are bearish. But beware of excesses. The Central Indicators scanner currently detects this:
Williams %R indicator is oversold : under -80
Type : Neutral
Timeframe : Daily
Pivot points : price is under support 3
Type : Neutral
Timeframe : Weekly
MACD crosses DOWN its Moving Average
Type : Bearish
Timeframe : Daily
Price is back over the pivot point
Type : Bullish
Timeframe : Weekly
Price is back under the pivot point
Type : Bearish
Timeframe : Daily
Momentum indicator is back over 0
Type : Bullish
Timeframe : Daily
Central Patterns, the market scanner focusing on chart patterns, resistances and supports found these results:
Near support of channel
Type : Bullish
Timeframe : Daily
Horizontal support is broken
Type : Bearish
Timeframe : Daily
The Central Candlesticks scanner, specialised in Japanese candlesticks, did not identify any signals.
| S3 | S2 | S1 | Price | R1 | R2 | R3 | |
|---|---|---|---|---|---|---|---|
| ProTrendLines | 398.02 | 413.36 | 437.58 | 440.01 | 445.95 | 455.84 | 464.91 |
| Change (%) | -9.54% | -6.06% | -0.55% | - | +1.35% | +3.60% | +5.66% |
| Change | -41.99 | -26.65 | -2.43 | - | +5.94 | +15.83 | +24.90 |
| Level | Minor | Minor | Major | - | Minor | Major | Major |
To determine price objectives, it is also possible to use the pivot points. Here is the price position in relation to pivot points:
| Pivot points | S3 | S2 | S1 | PP | R1 | R2 | R3 |
|---|---|---|---|---|---|---|---|
| Standard | 427.87 | 433.77 | 436.88 | 442.78 | 445.89 | 451.79 | 454.90 |
| Camarilla | 437.50 | 438.33 | 439.15 | 439.98 | 440.81 | 441.63 | 442.46 |
| Woodie | 426.47 | 433.07 | 435.48 | 442.08 | 444.49 | 451.09 | 453.50 |
| Fibonacci | 433.77 | 437.22 | 439.34 | 442.78 | 446.23 | 448.35 | 451.79 |
| Pivot points | S3 | S2 | S1 | PP | R1 | R2 | R3 |
|---|---|---|---|---|---|---|---|
| Standard | 441.78 | 448.19 | 456.30 | 462.71 | 470.82 | 477.23 | 485.34 |
| Camarilla | 460.41 | 461.74 | 463.07 | 464.40 | 465.73 | 467.06 | 468.39 |
| Woodie | 442.62 | 448.62 | 457.14 | 463.14 | 471.66 | 477.66 | 486.18 |
| Fibonacci | 448.19 | 453.74 | 457.17 | 462.71 | 468.26 | 471.69 | 477.23 |
| Pivot points | S3 | S2 | S1 | PP | R1 | R2 | R3 |
|---|---|---|---|---|---|---|---|
| Standard | 376.83 | 408.42 | 434.87 | 466.46 | 492.91 | 524.50 | 550.95 |
| Camarilla | 445.35 | 450.67 | 455.99 | 461.31 | 466.63 | 471.95 | 477.27 |
| Woodie | 374.25 | 407.14 | 432.29 | 465.18 | 490.33 | 523.22 | 548.37 |
| Fibonacci | 408.42 | 430.60 | 444.29 | 466.46 | 488.64 | 502.33 | 524.50 |
Numerical data
The following are the details of the technical indicators and moving averages that were collected to generate this technical analysis:
| RSI (14): | 38.23 | |
| MACD (12,26,9): | -4.1500 | |
| Directional Movement: | -16.69 | |
| AROON (14): | 42.86 | |
| DEMA (21): | 450.76 | |
| Parabolic SAR (0,02-0,02-0,2): | 467.48 | |
| Elder Ray (13): | -13.04 | |
| Super Trend (3,10): | 469.49 | |
| Zig ZAG (10): | 440.71 | |
| VORTEX (21): | 0.8400 | |
| Stochastique (14,3,5): | 18.71 | |
| TEMA (21): | 448.49 | |
| Williams %R (14): | -88.17 | |
| Chande Momentum Oscillator (20): | -2.79 | |
| Repulse (5,40,3): | -3.6300 | |
| ROCnROLL: | 2 | |
| TRIX (15,9): | -0.0800 | |
| Courbe Coppock: | 1.33 |
| MA7: | 453.70 | |
| MA20: | 453.27 | |
| MA50: | 460.92 | |
| MA100: | 470.44 | |
| MAexp7: | 449.76 | |
| MAexp20: | 455.68 | |
| MAexp50: | 461.14 | |
| MAexp100: | 463.43 | |
| Price / MA7: | -3.02% | |
| Price / MA20: | -2.93% | |
| Price / MA50: | -4.54% | |
| Price / MA100: | -6.47% | |
| Price / MAexp7: | -2.17% | |
| Price / MAexp20: | -3.44% | |
| Price / MAexp50: | -4.58% | |
| Price / MAexp100: | -5.05% |
News
The latest news and videos published on CREDIT ACCEPTANCE at the time of the analysis were as follows:
- Investor Expectations to Drive Momentum within Electronic Arts, Live Nation Entertainment, Columbus McKinnon, Advanced Energy Industries, Credit Acceptance, and Model N — Discovering Underlying Factors of Influence
- Flagship Credit Acceptance Launches Improved Online Customer Portal
- Lifshitz & Miller LLP Announces Investigation of Banro Corp., Credit Acceptance Corp., Extreme Networks, Inc., Luxoft Holding, Inc., Micro Focus International PLC, Switch, Inc., Synacor, Inc., and Vuzix Corporation
- Analysis: Positioning to Benefit within ForeScout Technologies, CommerceHub, Newtek Business Services, Credit Acceptance, Akari Therapeutics, and Brady — Research Highlights Growth, Revenue, and Consolidated Results
- Credit Acceptance Corporation to Host Earnings Call
About author

Online


Add a comment
Comments
0 comments on the analysis CREDIT ACCEPTANCE - Daily