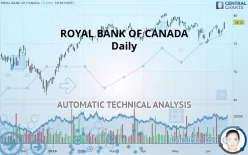
ROYAL BANK OF CANADA - Daily - Technical analysis published on 06/19/2019 (GMT)
- 289
- 0
- Who voted?
Click here for a new analysis!
- Timeframe : Daily
- - Analysis generated on
- Status : TARGET REACHED

Summary of the analysis

Additional analysis
Quotes
ROYAL BANK OF CANADA rating 78.72 USD. The price registered an increase of +1.92% on the session and was between 77.55 USD and 78.82 USD. This implies that the price is at +1.51% from its lowest and at -0.13% from its highest.The Central Gaps scanner detects a bullish opening marking the presence of buyers ahead of sellers at the opening but not sufficiently marked to allow the price to register a quotation gap.
Bullish opening
Type : Bullish
Timeframe : Openning
A study of price movements over other periods shows the following variations:
Near a new HIGH record (5 years)
Type : Bullish
Timeframe : Weekly
Near a new HIGH record (1 year)
Type : Bullish
Timeframe : Weekly
Near a new HIGH record (1st january)
Type : Bullish
Timeframe : Weekly
Near a new LOW record (1 month)
Type : Bearish
Timeframe : Weekly
Technical
Technical analysis of ROYAL BANK OF CANADA in Daily shows a strongly overall bullish trend. 89.29% of the signals given by moving averages are bullish. The overall trend is supported by the strong bullish signals from short-term moving averages. The Central Indicators scanner does not detect any result on moving averages that would impact this trend.
Technical indicators are strongly bullish, suggesting that the price increase should continue.
Caution: the Central Indicators scanner currently detects an excess:
Williams %R indicator is overbought : over -20
Type : Neutral
Timeframe : Daily
Pivot points : price is over resistance 1
Type : Neutral
Timeframe : Weekly
Pivot points : price is over resistance 3
Type : Neutral
Timeframe : Daily
Price is back under the pivot point
Type : Bearish
Timeframe : Weekly
The Central Patterns scanner, which studies chart patterns, resistances and supports, has identified these signals:
Near horizontal resistance
Type : Bearish
Timeframe : Daily
Resistance of channel is broken
Type : Bullish
Timeframe : Daily
Resistance of triangle is broken
Type : Bullish
Timeframe : Daily
Central Candlesticks, the scanner specialised in Japanese candlesticks, detects this inversion signal that could impact the current short-term trend:
Doji
Type : Neutral
Timeframe : Daily
| S3 | S2 | S1 | Price | R1 | R2 | |
|---|---|---|---|---|---|---|
| ProTrendLines | 71.61 | 75.87 | 78.49 | 78.72 | 80.95 | 86.75 |
| Change (%) | -9.03% | -3.62% | -0.29% | - | +2.83% | +10.20% |
| Change | -7.11 | -2.85 | -0.23 | - | +2.23 | +8.03 |
| Level | Minor | Major | Major | - | Major | Intermediate |
To determine price objectives, it is also possible to use the pivot points. Here is the price position in relation to pivot points:
| Pivot points | S3 | S2 | S1 | PP | R1 | R2 | R3 |
|---|---|---|---|---|---|---|---|
| Standard | 76.32 | 76.71 | 76.97 | 77.36 | 77.62 | 78.01 | 78.27 |
| Camarilla | 77.06 | 77.12 | 77.18 | 77.24 | 77.30 | 77.36 | 77.42 |
| Woodie | 76.26 | 76.68 | 76.92 | 77.33 | 77.57 | 77.98 | 78.21 |
| Fibonacci | 76.71 | 76.95 | 77.11 | 77.36 | 77.60 | 77.76 | 78.01 |
| Pivot points | S3 | S2 | S1 | PP | R1 | R2 | R3 |
|---|---|---|---|---|---|---|---|
| Standard | 74.69 | 75.64 | 76.43 | 77.38 | 78.17 | 79.12 | 79.91 |
| Camarilla | 76.73 | 76.89 | 77.05 | 77.21 | 77.37 | 77.53 | 77.69 |
| Woodie | 74.60 | 75.60 | 76.34 | 77.34 | 78.08 | 79.08 | 79.82 |
| Fibonacci | 75.64 | 76.31 | 76.72 | 77.38 | 78.05 | 78.46 | 79.12 |
Numerical data
The following is the status of the technical indicators and moving averages at the time of publication of this technical analysis:
| RSI (14): | 59.80 | |
| MACD (12,26,9): | 0.0000 | |
| Directional Movement: | 4.80 | |
| AROON (14): | 85.71 | |
| DEMA (21): | 77.31 | |
| Parabolic SAR (0,02-0,02-0,2): | 75.95 | |
| Elder Ray (13): | 0.79 | |
| Super Trend (3,10): | 75.29 | |
| Zig ZAG (10): | 78.72 | |
| VORTEX (21): | 0.9300 | |
| Stochastique (14,3,5): | 77.61 | |
| TEMA (21): | 77.38 | |
| Williams %R (14): | -2.54 | |
| Chande Momentum Oscillator (20): | 3.57 | |
| Repulse (5,40,3): | 1.7500 | |
| ROCnROLL: | 1 | |
| TRIX (15,9): | -0.0400 | |
| Courbe Coppock: | 2.18 |
| MA7: | 77.54 | |
| MA20: | 77.07 | |
| MA50: | 77.88 | |
| MA100: | 76.99 | |
| MAexp7: | 77.59 | |
| MAexp20: | 77.39 | |
| MAexp50: | 77.33 | |
| MAexp100: | 76.57 | |
| Price / MA7: | +1.52% | |
| Price / MA20: | +2.14% | |
| Price / MA50: | +1.08% | |
| Price / MA100: | +2.25% | |
| Price / MAexp7: | +1.46% | |
| Price / MAexp20: | +1.72% | |
| Price / MAexp50: | +1.80% | |
| Price / MAexp100: | +2.81% |
News
The latest news and videos published on ROYAL BANK OF CANADA at the time of the analysis were as follows:
- Aegis Capital Corp. (www.aegiscapcorp.com) is pleased to announce Benjamin Zucker has joined the firm as Head of Specialty Finance Research.
- Eve & Co Enters Into Credit Facility With Royal Bank of Canada to Fund Expansion of Its Greenhouse Production Facility
- Consolidated Research: 2018 Summary Expectations for At Home Group, Royal Bank Of Canada, Curis, Novavax, HNI, and Freshpet — Fundamental Analysis, Key Performance Indications
- Investor Expectations to Drive Momentum within Esperion Therapeutics, Celestica, Sapiens International Corporation N.V, Royal Bank Of Canada, CSS Industries, and SSR Mining — Discovering Underlying Factors of Influence
- Royal Bank of Canada to Host Earnings Call
About author

Online


Add a comment
Comments
0 comments on the analysis ROYAL BANK OF CANADA - Daily