| Open: | 34.84 |
| Change: | -0.73 |
| Volume: | 59,590 |
| Low: | 33.84 |
| High: | 34.90 |
| High / Low range: | 1.06 |
| Type: | Stocks |
| Ticker: | RY |
| ISIN: | CA7800871021 |
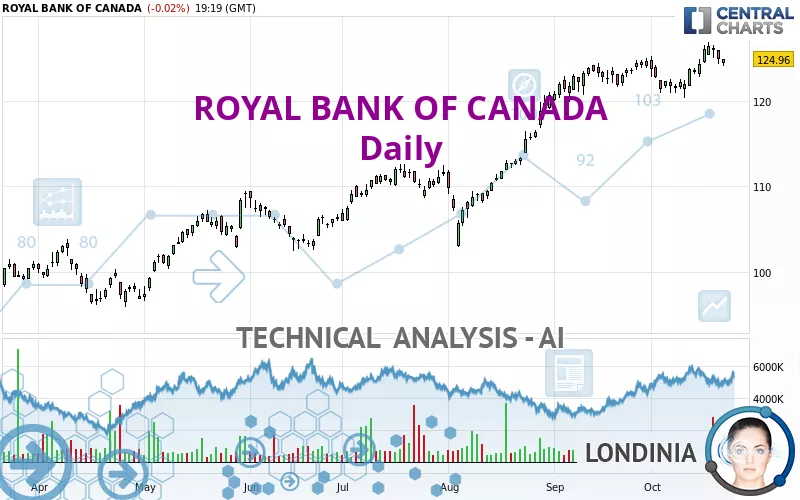
ROYAL BANK OF CANADA - Daily - Technical analysis published on 10/22/2024 (GMT)
- 153
- 0
- 10/22/2024 - 19:35
Click here for a new analysis!
- Timeframe : Daily
- - Analysis generated on 10/22/2024 - 19:35
- Status : LEVEL MAINTAINED
Summary of the analysis

Additional analysis
Quotes
The ROYAL BANK OF CANADA price is 124.96 USD. The price is lower by -0.02% since the last closing and was traded between 124.13 USD and 124.97 USD over the period. The price is currently at +0.67% from its lowest and -0.01% from its highest.The Central Gaps scanner detects a bearish opening. A small advantage for sellers in the very short term.
Bearish opening
Type : Bearish
Timeframe : Openning
Here is a more detailed summary of the historical variations registered by ROYAL BANK OF CANADA:
Near a new HIGH record (5 years)
Type : Bullish
Timeframe : Weekly
Near a new HIGH record (1 year)
Type : Bullish
Timeframe : Weekly
Near a new HIGH record (1st january)
Type : Bullish
Timeframe : Weekly
Near a new LOW record (1 month)
Type : Bearish
Timeframe : Weekly
Technical
Technical analysis of ROYAL BANK OF CANADA in Daily shows a strongly overall bullish trend. The signals given by the moving averages are 92.86% bullish. This strong bullish trend is confirmed by the strong signals currently being given by short-term moving averages. There is no crossing of moving average by the price or crossing of moving averages between themselves.
The technical indicators are bullish. There is still some doubt about the price increase.
Central Indicators, the scanner specialised in technical indicators, has identified this signal:
Price is back under the pivot point
Type : Bearish
Timeframe : Weekly
The Central Patterns scanner, which studies chart patterns, resistances and supports, has identified this signal:
Near resistance of channel
Type : Bearish
Timeframe : Daily
The Central Candlesticks scanner, specialised in Japanese candlesticks, did not identify any signals.
| S3 | S2 | S1 | Price | |
|---|---|---|---|---|
| ProTrendLines | 109.31 | 113.27 | 121.41 | 124.96 |
| Change (%) | -12.52% | -9.35% | -2.84% | - |
| Change | -15.65 | -11.69 | -3.55 | - |
| Level | Minor | Major | Major | - |
Attention could also be paid to pivot points to set price objectives:
| Pivot points | S3 | S2 | S1 | PP | R1 | R2 | R3 |
|---|---|---|---|---|---|---|---|
| Standard | 122.66 | 123.54 | 124.26 | 125.14 | 125.86 | 126.74 | 127.46 |
| Camarilla | 124.55 | 124.70 | 124.84 | 124.99 | 125.14 | 125.28 | 125.43 |
| Woodie | 122.59 | 123.50 | 124.19 | 125.10 | 125.79 | 126.70 | 127.39 |
| Fibonacci | 123.54 | 124.15 | 124.53 | 125.14 | 125.75 | 126.13 | 126.74 |
| Pivot points | S3 | S2 | S1 | PP | R1 | R2 | R3 |
|---|---|---|---|---|---|---|---|
| Standard | 119.57 | 121.23 | 123.64 | 125.30 | 127.71 | 129.37 | 131.78 |
| Camarilla | 124.93 | 125.30 | 125.68 | 126.05 | 126.42 | 126.80 | 127.17 |
| Woodie | 119.95 | 121.42 | 124.02 | 125.49 | 128.09 | 129.56 | 132.16 |
| Fibonacci | 121.23 | 122.79 | 123.75 | 125.30 | 126.86 | 127.82 | 129.37 |
| Pivot points | S3 | S2 | S1 | PP | R1 | R2 | R3 |
|---|---|---|---|---|---|---|---|
| Standard | 116.24 | 118.09 | 121.41 | 123.26 | 126.58 | 128.43 | 131.75 |
| Camarilla | 123.31 | 123.78 | 124.26 | 124.73 | 125.20 | 125.68 | 126.15 |
| Woodie | 116.98 | 118.46 | 122.15 | 123.63 | 127.32 | 128.80 | 132.49 |
| Fibonacci | 118.09 | 120.07 | 121.29 | 123.26 | 125.24 | 126.46 | 128.43 |
Numerical data
The following is the status of the technical indicators and moving averages at the time of publication of this technical analysis:
| RSI (14): | 59.33 | |
| MACD (12,26,9): | 1.3000 | |
| Directional Movement: | 7.93 | |
| AROON (14): | 35.71 | |
| DEMA (21): | 125.46 | |
| Parabolic SAR (0,02-0,02-0,2): | 121.46 | |
| Elder Ray (13): | 0.93 | |
| Super Trend (3,10): | 121.41 | |
| Zig ZAG (10): | 124.99 | |
| VORTEX (21): | 1.0600 | |
| Stochastique (14,3,5): | 82.88 | |
| TEMA (21): | 125.05 | |
| Williams %R (14): | -30.03 | |
| Chande Momentum Oscillator (20): | 3.60 | |
| Repulse (5,40,3): | 0.4700 | |
| ROCnROLL: | 1 | |
| TRIX (15,9): | 0.1400 | |
| Courbe Coppock: | 2.20 |
| MA7: | 125.04 | |
| MA20: | 123.69 | |
| MA50: | 120.42 | |
| MA100: | 114.26 | |
| MAexp7: | 124.94 | |
| MAexp20: | 123.66 | |
| MAexp50: | 120.38 | |
| MAexp100: | 115.40 | |
| Price / MA7: | -0.06% | |
| Price / MA20: | +1.03% | |
| Price / MA50: | +3.77% | |
| Price / MA100: | +9.36% | |
| Price / MAexp7: | +0.02% | |
| Price / MAexp20: | +1.05% | |
| Price / MAexp50: | +3.80% | |
| Price / MAexp100: | +8.28% |
News
The last news published on ROYAL BANK OF CANADA at the time of the generation of this analysis was as follows:
- 04/17/2024 - 22:08 Royal Bank of Canada announces NVCC AT1 Limited Recourse Capital Notes issue
- 07/03/2023 - 07:04 CACEIS and Royal Bank of Canada complete acquisition of RBC Investor Services' operations in Europe and Malaysia
- 03/21/2023 - 11:15 CLEARBLUE MARKETS ANNOUNCES ROYAL BANK OF CANADA AS MINORITY INVESTOR AS PART OF SERIES A FINANCING
- 03/21/2023 - 11:15 CLEARBLUE MARKETS ANNOUNCES ROYAL BANK OF CANADA AS MINORITY INVESTOR AS PART OF SERIES A FINANCING
- 11/29/2022 - 11:30 HSBC Agrees to Sell Its Business in Canada to Royal Bank of Canada
About author
Online


Add a comment
Comments
0 comments on the analysis ROYAL BANK OF CANADA - Daily