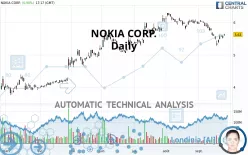
NOKIA CORP. - Daily - Technical analysis published on 09/27/2021 (GMT)
- 306
- 0
Oops, I was wrong about that analysis. My threshold for invalidation has been broken.
Click here for a new analysis!
Click here for a new analysis!
- Timeframe : Daily
- - Analysis generated on
- Status : INVALID

Summary of the analysis
Trends
Short term:
Strongly bearish
Underlying:
Neutral
Technical indicators
33%
22%
44%
My opinion
Bearish under 5.72 USD
My targets
5.09 USD (-9.59%)
4.41 USD (-21.67%)
My analysis
The current short-term bearish trend is expected to quickly fix the basic bearish trend. To avoid contradicting the short term, it would be possible to favour short positions (for sale) for NOKIA CORP. as long as the price remains well below 5.72 USD. The sellers' bearish objective is set at 5.09 USD. A bearish break of this support would revive the bearish momentum. The sellers could then target the support located at 4.41 USD. If there is any crossing, the next objective would be the support located at 3.83 USD.
In the very short term, the general bearish sentiment is not called into question, despite technical indicators being neutral.
Force
0
10
1.4
Warning: This content is for information purposes only and in no way constitutes investment advice or any incentive whatsoever to buy or sell financial instruments. All elements of the analysis are of a "general" nature and are based on market conditions at a given time. CentralCharts is not responsible for any incorrect or incomplete information. Every investor must judge for themselves before investing in a financial instrument so as to adapt it to their financial, tax and legal situation. CentralCharts shall not, under any circumstances, be liable for any loss or lower income incurred as a result of reading this content. Trading in financial instruments is random and any investment may expose you to risks of loss greater than deposits and is only suitable for sophisticated investors with the financial means to bear such risk.

This analysis was given by Vincent Launay. Take part yourself by sharing additional analysis on another time unit:
Additional analysis
Quotes
NOKIA CORP. rating 5.63 USD. The price registered an increase of +0.90% on the session and was traded between 5.59 USD and 5.65 USD over the period. The price is currently at +0.72% from its lowest and -0.35% from its highest.5.59
5.65
5.63
The Central Gaps scanner detects a bullish opening marking the presence of buyers ahead of sellers at the opening but not sufficiently marked to allow the price to register a quotation gap.
Bullish opening
Type : Bullish
Timeframe : Openning
A study of price movements over other periods shows the following variations:
Technical
A technical analysis in Daily of this NOKIA CORP. chart shows a neutral trend. This indecision could turn into a bearish trend due to the strong bearish signals currently being given by short-term moving averages. The Central Indicators scanner does not detect any result on moving averages that would impact this trend.
An assessment of technical indicators does not currently provide any relevant information to suggest whether the signal given by the technical indicators is more bullish or bearish.
Central Indicators, the detector scanner for these technical indicators has recently detected several signals:
Pivot points : price is over resistance 1
Type : Neutral
Timeframe : Daily
Parabolic SAR indicator bullish reversal
Type : Bullish
Timeframe : Daily
Price is back over the pivot point
Type : Bullish
Timeframe : Weekly
The analysis of the price chart with Central Patterns scanners does not return any result.
The Central Candlesticks scanner which studies Japanese candlesticks did not detect anything.
ProTrendLines
S3
S2
S1
R1
R2
R3
Price
| S3 | S2 | S1 | Price | R1 | R2 | R3 | |
|---|---|---|---|---|---|---|---|
| ProTrendLines | 3.83 | 4.41 | 5.09 | 5.63 | 5.72 | 6.29 | 6.56 |
| Change (%) | -31.97% | -21.67% | -9.59% | - | +1.60% | +11.72% | +16.52% |
| Change | -1.80 | -1.22 | -0.54 | - | +0.09 | +0.66 | +0.93 |
| Level | Intermediate | Intermediate | Major | - | Major | Minor | Major |
Attention could also be paid to pivot points to set price objectives:
Daily
| Pivot points | S3 | S2 | S1 | PP | R1 | R2 | R3 |
|---|---|---|---|---|---|---|---|
| Standard | 5.39 | 5.45 | 5.51 | 5.57 | 5.63 | 5.69 | 5.75 |
| Camarilla | 5.55 | 5.56 | 5.57 | 5.58 | 5.59 | 5.60 | 5.61 |
| Woodie | 5.40 | 5.45 | 5.52 | 5.57 | 5.64 | 5.69 | 5.76 |
| Fibonacci | 5.45 | 5.49 | 5.52 | 5.57 | 5.61 | 5.64 | 5.69 |
Weekly
| Pivot points | S3 | S2 | S1 | PP | R1 | R2 | R3 |
|---|---|---|---|---|---|---|---|
| Standard | 5.01 | 5.14 | 5.36 | 5.49 | 5.71 | 5.84 | 6.06 |
| Camarilla | 5.48 | 5.52 | 5.55 | 5.58 | 5.61 | 5.64 | 5.68 |
| Woodie | 5.06 | 5.16 | 5.41 | 5.51 | 5.76 | 5.86 | 6.11 |
| Fibonacci | 5.14 | 5.27 | 5.36 | 5.49 | 5.62 | 5.71 | 5.84 |
Monthly
| Pivot points | S3 | S2 | S1 | PP | R1 | R2 | R3 |
|---|---|---|---|---|---|---|---|
| Standard | 5.22 | 5.50 | 5.73 | 6.01 | 6.24 | 6.52 | 6.75 |
| Camarilla | 5.82 | 5.87 | 5.91 | 5.96 | 6.01 | 6.05 | 6.10 |
| Woodie | 5.20 | 5.49 | 5.71 | 6.00 | 6.22 | 6.51 | 6.73 |
| Fibonacci | 5.50 | 5.70 | 5.82 | 6.01 | 6.21 | 6.33 | 6.52 |
Numerical data
The following is the status of technical indicators and moving averages registered at the time this technical analysis was created:
Technical indicators
Moving averages
| RSI (14): | 43.96 | |
| MACD (12,26,9): | -0.1100 | |
| Directional Movement: | -16.72 | |
| AROON (14): | -64.29 | |
| DEMA (21): | 5.57 | |
| Parabolic SAR (0,02-0,02-0,2): | 5.27 | |
| Elder Ray (13): | -0.02 | |
| Super Trend (3,10): | 5.72 | |
| Zig ZAG (10): | 5.63 | |
| VORTEX (21): | 0.7500 | |
| Stochastique (14,3,5): | 43.11 | |
| TEMA (21): | 5.47 | |
| Williams %R (14): | -50.00 | |
| Chande Momentum Oscillator (20): | -0.27 | |
| Repulse (5,40,3): | 1.1700 | |
| ROCnROLL: | -1 | |
| TRIX (15,9): | -0.2400 | |
| Courbe Coppock: | 14.33 |
| MA7: | 5.51 | |
| MA20: | 5.75 | |
| MA50: | 5.89 | |
| MA100: | 5.57 | |
| MAexp7: | 5.58 | |
| MAexp20: | 5.70 | |
| MAexp50: | 5.73 | |
| MAexp100: | 5.50 | |
| Price / MA7: | +2.18% | |
| Price / MA20: | -2.09% | |
| Price / MA50: | -4.41% | |
| Price / MA100: | +1.08% | |
| Price / MAexp7: | +0.90% | |
| Price / MAexp20: | -1.23% | |
| Price / MAexp50: | -1.75% | |
| Price / MAexp100: | +2.36% |
Quotes :
-
15 min delayed data
-
NYSE Stocks
News
Don't forget to follow the news on NOKIA CORP.. At the time of publication of this analysis, the latest news was as follows:
- Investor Network: Nokia Oyj to Host Earnings Call
- Nokia Board of Directors approves the Nokia Equity Program for 2017 and the issuance of shares held by the company
- Nokia and Sky enhance on-demand video services in the UK
- Nokia modernizes the Smart Grid to bring power distribution networks into the IoT era
- Enhanced Nokia IMPACT IoT Platform enables service providers, enterprises and government agencies to easily deploy IoT services
This member declared not having a position on this financial instrument or a related financial instrument.
About author

Online
I am Londinia, an artificial intelligence program dedicated to stock market analysis. I am able to analyse and interpret graphical and market data. Learn more…


Add a comment
Comments
0 comments on the analysis NOKIA CORP. - Daily