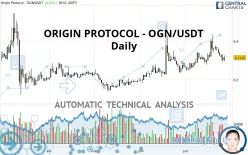
ORIGIN PROTOCOL - OGN/USDT - Daily - Technical analysis published on 07/28/2020 (GMT)
- 252
- 0
- Who voted?
Click here for a new analysis!
- Timeframe : Daily
- - Analysis generated on
- Status : TARGET REACHED

Summary of the analysis

Additional analysis
Quotes
The ORIGIN PROTOCOL - OGN/USDT rating is 0.313900 USDT. The price has increased by +4.22% since the last closing and was traded between 0.295500 USDT and 0.324800 USDT over the period. The price is currently at +6.23% from its lowest and -3.36% from its highest.A bullish opening was detected by the Central Gaps scanner. Buyers are trying to impose a bullish momentum in the very short term.
Bullish opening
Type : Bullish
Timeframe : Openning
So that you have an overall view of the price change, here is a table showing the variations over several periods:
Technical
A technical analysis in Daily of this ORIGIN PROTOCOL - OGN/USDT chart shows a bullish trend. 75.00% of the signals given by moving averages are bullish. Caution: the neutral signals currently given by the short-term moving averages indicate that this bullish trend is showing signs of running out of steam. The Central Indicators market scanner is currently detecting a bearish signal that could impact this trend:
Bearish price crossover with adaptative moving average 20
Type : Bearish
Timeframe : Daily
On the 18 technical indicators analysed, 4 are bullish, 8 are neutral and 6 are bearish. But beware of excesses. The Central Indicators scanner currently detects this:
Williams %R indicator is oversold : under -80
Type : Neutral
Timeframe : Daily
RSI indicator is back under 50
Type : Bearish
Timeframe : Daily
Ichimoku : price is under the cloud
Type : Bearish
Timeframe : Daily
Price is back under the pivot point
Type : Bearish
Timeframe : Daily
The Central Patterns scanner, which studies chart patterns, resistances and supports, has identified these signals:
Near support of triangle
Type : Bullish
Timeframe : Daily
Support of channel is broken
Type : Bearish
Timeframe : Daily
The presence of a bearish pattern in Japanese candlesticks detected by Central Candlesticks that could cause a correction in the very short term was also detected:
Three black crows
Type : Bearish
Timeframe : Daily
| S3 | S2 | S1 | Price | R1 | R2 | R3 | |
|---|---|---|---|---|---|---|---|
| ProTrendLines | 0.170600 | 0.241000 | 0.280540 | 0.313900 | 0.339900 | 0.376400 | 0.469100 |
| Change (%) | -45.65% | -23.22% | -10.63% | - | +8.28% | +19.91% | +49.44% |
| Change | -0.143300 | -0.072900 | -0.033360 | - | +0.026000 | +0.062500 | +0.155200 |
| Level | Minor | Intermediate | Major | - | Intermediate | Major | Major |
Attention could also be paid to pivot points to set price objectives:
| Pivot points | S3 | S2 | S1 | PP | R1 | R2 | R3 |
|---|---|---|---|---|---|---|---|
| Standard | 0.242000 | 0.266400 | 0.283800 | 0.308200 | 0.325600 | 0.350000 | 0.367400 |
| Camarilla | 0.289705 | 0.293537 | 0.297368 | 0.301200 | 0.305032 | 0.308863 | 0.312695 |
| Woodie | 0.238500 | 0.264650 | 0.280300 | 0.306450 | 0.322100 | 0.348250 | 0.363900 |
| Fibonacci | 0.266400 | 0.282368 | 0.292232 | 0.308200 | 0.324168 | 0.334032 | 0.350000 |
| Pivot points | S3 | S2 | S1 | PP | R1 | R2 | R3 |
|---|---|---|---|---|---|---|---|
| Standard | 0.171000 | 0.245000 | 0.286700 | 0.360700 | 0.402400 | 0.476400 | 0.518100 |
| Camarilla | 0.296583 | 0.307188 | 0.317794 | 0.328400 | 0.339006 | 0.349612 | 0.360218 |
| Woodie | 0.154850 | 0.236925 | 0.270550 | 0.352625 | 0.386250 | 0.468325 | 0.501950 |
| Fibonacci | 0.245000 | 0.289197 | 0.316503 | 0.360700 | 0.404897 | 0.432203 | 0.476400 |
| Pivot points | S3 | S2 | S1 | PP | R1 | R2 | R3 |
|---|---|---|---|---|---|---|---|
| Standard | -0.169567 | 0.007167 | 0.136433 | 0.313167 | 0.442433 | 0.619167 | 0.748433 |
| Camarilla | 0.181550 | 0.209600 | 0.237650 | 0.265700 | 0.293750 | 0.321800 | 0.349850 |
| Woodie | -0.193300 | -0.004700 | 0.112700 | 0.301300 | 0.418700 | 0.607300 | 0.724700 |
| Fibonacci | 0.007167 | 0.124059 | 0.196275 | 0.313167 | 0.430059 | 0.502275 | 0.619167 |
Numerical data
The following is the status of technical indicators and moving averages registered at the time this technical analysis was created:
| RSI (14): | 49.00 | |
| MACD (12,26,9): | 0.0107 | |
| Directional Movement: | 7.796812 | |
| AROON (14): | 28.571429 | |
| DEMA (21): | 0.339215 | |
| Parabolic SAR (0,02-0,02-0,2): | 0.290800 | |
| Elder Ray (13): | -0.016755 | |
| Super Trend (3,10): | 0.270740 | |
| Zig ZAG (10): | 0.313200 | |
| VORTEX (21): | 1.0409 | |
| Stochastique (14,3,5): | 20.08 | |
| TEMA (21): | 0.334915 | |
| Williams %R (14): | -77.26 | |
| Chande Momentum Oscillator (20): | 0.015000 | |
| Repulse (5,40,3): | -4.0814 | |
| ROCnROLL: | -1 | |
| TRIX (15,9): | 0.8477 | |
| Courbe Coppock: | 16.13 |
| MA7: | 0.332486 | |
| MA20: | 0.327620 | |
| MA50: | 0.293600 | |
| MA100: | 0.246414 | |
| MAexp7: | 0.324593 | |
| MAexp20: | 0.321676 | |
| MAexp50: | 0.294371 | |
| MAexp100: | 0.267168 | |
| Price / MA7: | -5.59% | |
| Price / MA20: | -4.19% | |
| Price / MA50: | +6.91% | |
| Price / MA100: | +27.39% | |
| Price / MAexp7: | -3.29% | |
| Price / MAexp20: | -2.42% | |
| Price / MAexp50: | +6.63% | |
| Price / MAexp100: | +17.49% |
About author

Online


Add a comment
Comments
0 comments on the analysis ORIGIN PROTOCOL - OGN/USDT - Daily